Figure 1.

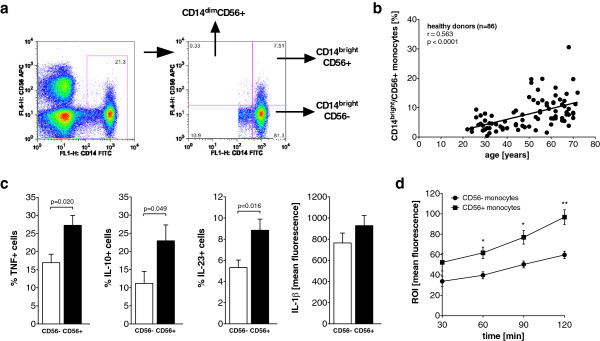
CD14bright/CD56+ monocyte subset is expanded in older healthy controls and produces more cytokines in response to lipopolysaccharide. (a) Representative dot plot of CD14 and CD56 expression on monocytes. Three relevant subpopulations are separated by the quadrants and marked by the arrows in the right panel. APC, allophycocyanin; FITC, fluorescein isothiocyanate; FL1-H, fluorescence intensity on channel that detects emissions from fluorescein isothiocyanate. (b) Scatterplot showing the correlation between age and the peripheral blood frequencies of CD14bright/CD56+ monocytes in healthy controls. (c) Bar graphs depict the frequency of tumor necrosis factor-positive (TNF+) (n = 5), interleukin 10-positive (IL-10+) (n = 8) and IL-23+ (n = 7) cells and the mean intracellular IL-1β content (n = 7) in CD56+ and CD56– monocytes of healthy controls in response to lipopolysaccharide. (d) Spontaneous reactive oxygen intermediate (ROI) production of CD56– and CD56+ monocytes (n = 4).
