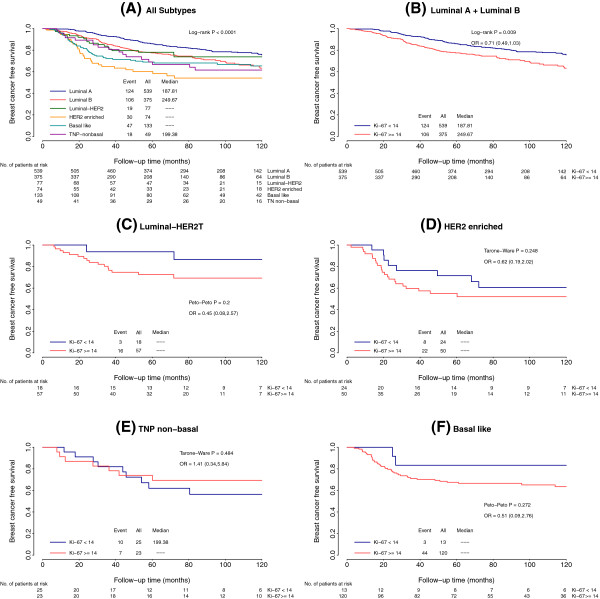
Figure 3.
Kaplan-Meier curves for breast cancer–free survival based on intrinsic subtypes (six markers) and proliferation rate. (A) Whole series according to six intrinsic subtypes. TNP, triple-negative phenotype. (B) Luminal tumors according to Ki-67 value. OR, odds ratio. (C) Luminal human epidermal growth factor receptor 2 (HER2) tumors according to Ki-67 value. (D) HER2-enriched tumors according to Ki-67 value. (E) Triple-negative-nonbasal tumors according to Ki-67 value. (F) Basal-like tumors according to Ki-67 value.

