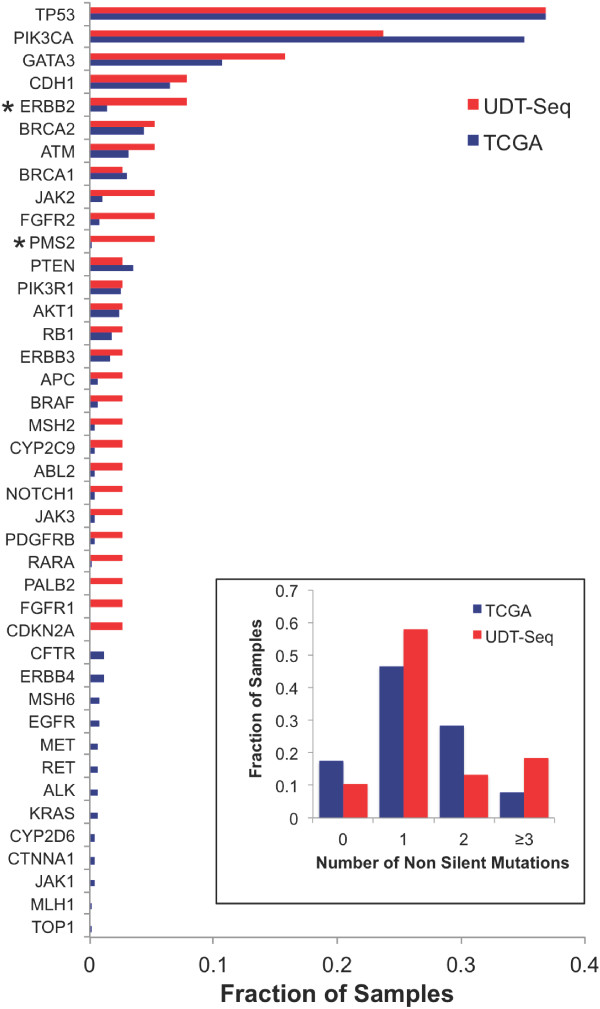
Figure 3.
Comparison with The Cancer Genome Atlas cohort. Bar graph representing the fraction of samples with nonsilent somatic mutations in The Cancer Genome Atlas (TCGA) cohort (n = 507, blue) and the studied cohort (n = 38, red). *Statistically significant difference (Fisher test P <0.05). Inset: bar graph indicating the fraction of samples with none, one, two, or three or more nonsilent mutations over the entire TCGA cohort (blue) or studied cohort (red). UDT-Seq, ultra-deep targeted sequencing.

