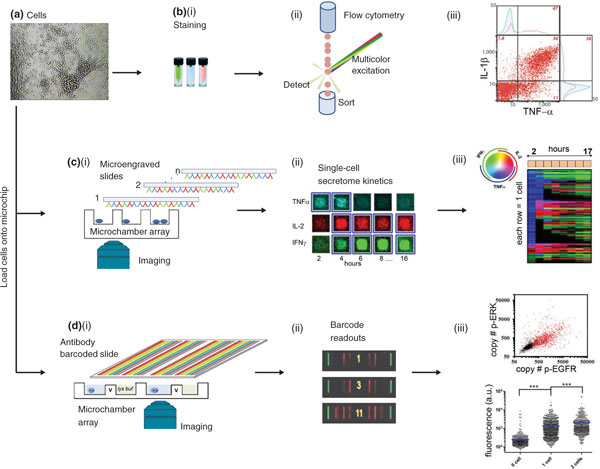
Figure 1.
Selected tools for single-cell functional proteomics. Three technology platforms are illustrated, along with data that highlight the unique strengths of each platform. (a) All platforms start with a single-cell suspension. (b)(i) Intracellular staining (ICS) flow cytometry for assaying for secreted (functional) proteins requires blocking cell secretion during an incubation step, fixing the cells, and then permeabilizing the cells to enable antibody staining. (b)(ii) Proteins are colorimetrically detected by streaming the cells, one at a time, through multicolor laser excitation. (b)(iii) A flow cytometry scatter plot showing the correlation of two effector proteins detected from stimulated CD8+ T cells. This plot reflects the excellent statistics achievable using this technique (adapted from [5] with permission). (c)(i) Microengraving assays start by isolating single cells into microwells, several thousand of which are patterned onto a single chip. A glass substrate that is microengraved with various capture antibodies covers the microwells. The substrate can be replaced at various times to reveal protein-specific secretion kinetics. The phenotype of the cells can also be determined by imaging, using fluorophore-labeled antibodies against specific cell-surface markers. (c)(ii) Secreted protein levels are measured by developing the microengraved slides with fluorophore-labeled, secondary antibodies and correlating the fluorescence signal with the microchamber address. (c)(iii) Assembled traces reveal the secretion kinetics for three proteins from a specific T-cell phenotype. The color coding key is provided in the colored circle at top left. Adapted from [37] with permission. (d)(i) Single-cell barcode chip (SCBC) assays also begin by isolating cells within small-volume microchambers. Flexibility of microfluidics design enables individual cells to be lyzed for analysis of cytoplasmic proteins and membrane and secreted proteins. Proteins are captured on miniature antibody barcode arrays. A full barcode representing the panel of proteins to be assayed is incorporated into each microchamber. (d)(ii) SCBC assays yield data on single cells and on small cell populations. Three developed barcodes are shown; the yellow number indicates the numbers of cells in the associated microchamber. (d)(ii) Statistical analysis of single-cell data collected from model brain cancer cells. Top: scatter plot showing the correlation of two phosphoproteins. The black or red dots represent data from microchambers containing 0 or 1 cells, respectively. Bottom: scatter plots show the statistical uniqueness of the 0-cell, 1-cell, and 2-cell datasets for p-EGFR. a.u., arbitrary units. Adapted from [28] with permission.

