
Figure 6.
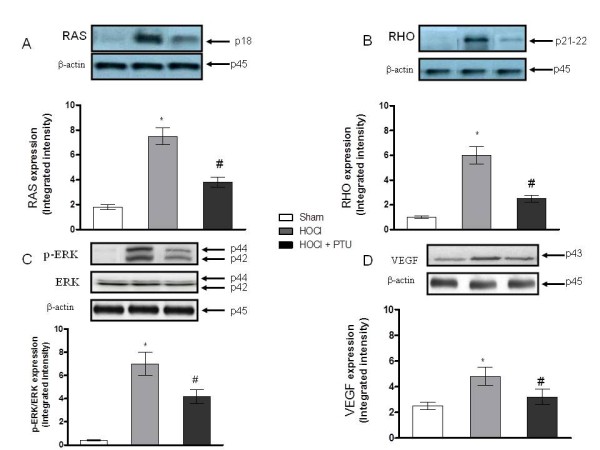
Effect of propylthiouracil on RAS (A), RHO (B), pERK (C), VEGF (D) protein expressions in skin tissue samples. Values in A through D are expressed by the mean and SD relative for each animal group. *P < 0.001 versus Sham; #P < 0.001 versus HOCl. HOCl group (n = 10), HOCl + PTU group (n = 10), Sham (n = 5).