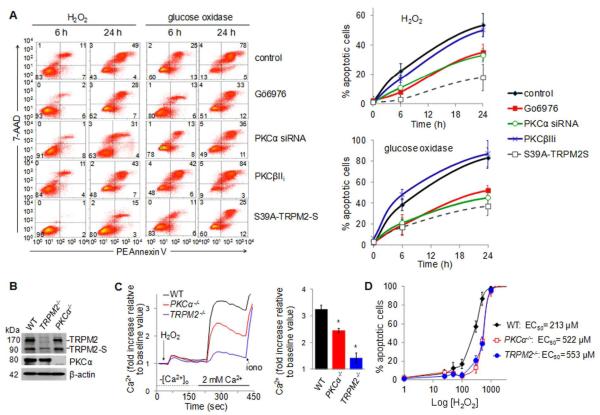
Figure 6. H2O2-induced endothelial cell apoptosis resulting from TRPM2-mediated Ca2+ influx.
HPAECs (A) and mouse lung endothelial cells (B-D) challenged with H2O2 were labeled with PE-Annexin/7-AAD. (A) Flow-cytometry histograms (Left) and summary plots of apoptosis (Right) 0, 6, and 24 h after challenge with H2O2 (300 μmol/L) or glucose oxidase/glucose to generate 320 nmol/L H2O2/min for 90 min, as a function of PKCα inhibition or silencing (± SEM, n=5). (B-D) Mouse endothelial cells were isolated from lungs of TRPM2−/−, PKCα−/−, and WT mice. (B) Western blot verifying absence of PKCα expression in PKCα−/− cells and of TRPM2 expression in TRPM2−/− cells. (C) Left, Ca2+ mobilization assay using “Ca2+ add-back” protocol with the Fluor-3 Ca2+ indicator. Right, Mean ratiometric values (± SEM) for steady-state [Ca2+]i (n=6). *p ≤ 0.0001 vs. WT cells (t-test). (D) Dose-response curve for H2O2-induced apoptosis in mouse endothelial cells detected by flow cytometry. Deletion of PKCα or TRPM2 caused ~2.5-fold rightward shift in the dose-response curve.

