
Figure 1.
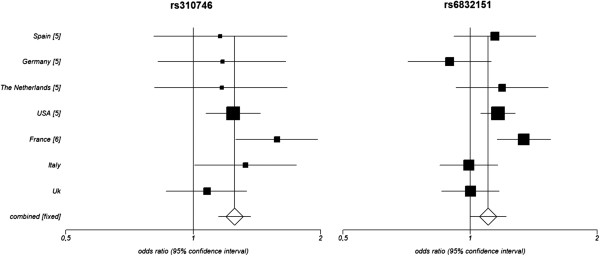
Forest plots of PPARG rs310746 and CHRNA9 rs6832151. Forest plots showing the odds ratios and confidence intervals of both PPARG rs310746 (under a fixed-effects model) and CHRNA9 rs6832151 (under a random-effects model) in all the populations included in the combined analysis.