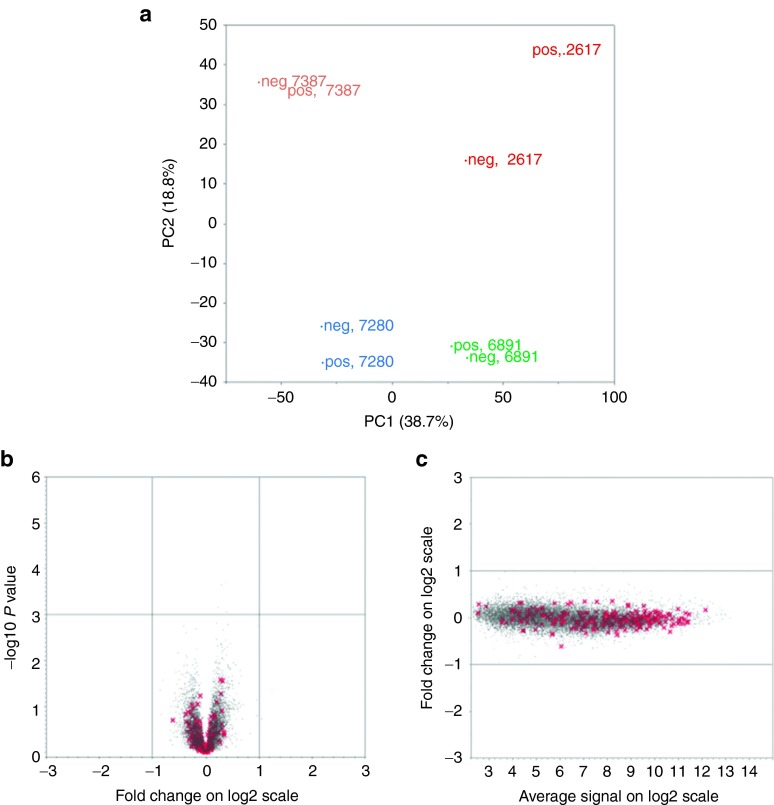
Figure 2.
Comparison of gene expression profiles between transduced and untransduced bone marrow CD34+ cells. (a) Principal component analysis of global gene expression patterns in GFP+ (pos) and GFP− (neg) CD34+ cells sorted from the bone marrow of four rhesus macaques transplanted with lentivirally transduced autologous CD34+ cells 3–9 years before. The principal component analysis shows that the variation between the four animals was much greater than the variation between GFP+ and GFP− CD34+ cells overall. The first component (PC1) on the x axis and the second component (PC2) on the y axis explain a cumulative 57.5% of the variance between the four animals. (b) A Volcano plot of log2 fold changes versus one-way analysis of variance P value (-log10 scale) comparing the expression of each individual gene (red x marks Sanger cancer genes, gray dots mark all other genes) in the GFP+ and GFP− cells from all four animals. No genes were up- or downregulated more than twofold (log2 = 1) between the cell populations, as demonstrated by lack of any dots outside the -1 and 1 thresholds on the x axis, and there was no significant difference in level of expression for any genes comparing GFP+ and GFP− cells. (c) MvA plot of the average log2 intensities of expression for individual genes on the x axis versus the log2 fold change in GFP(+) versus GFP(−) cells on the y axis. Each dot represents one transcript on the plot, red x's for Sanger cancer genes and gray dots for other genes. The majority of Sanger cancer genes show high expression level in both GFP(+) and GFP(−) two conditions.

