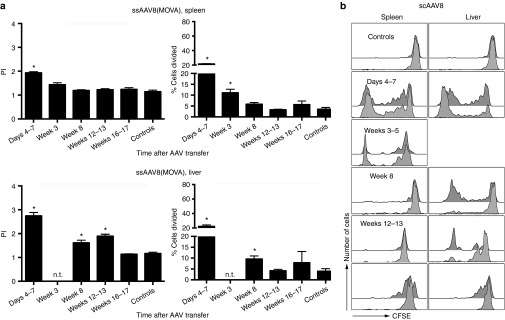
Figure 7.

Proliferation of CD8+ T cells from OT-1 mice in scAAV8(MOVA)-hF.IX-transduced mice. The experimental design and the layout of the graphs are identical to those of experiments shown in Figure 2a,b using scAAV8(MOVA)-F.IX vectors for injection of mice. Numbers of mice per group were as follows: (spleens) days 4–7 = 5, weeks 3–5 = 3, week 8 = 5, weeks 12–13 = 2, weeks 16–17 = 3, controls = 8; (liver) days 4–7 = 5, weeks 3–5 = not tested, week 8 = 5, weeks 12–13 = 3; weeks 16–17 = 9, controls = 12. For the proliferation indices, significant P values were as follows: (spleens) days 4–7 < 0.0001, weeks 3–5 = 0.01; (liver) days 4–7 = < 0.0001, week 8 = 0.001, weeks 12–13 = 0.0001. For % cells proliferating, significant P values were as follows: (spleens) days 4–7 < 0.0001, weeks 3–5 = 0.0007; (liver): days 4–7 = 0.01, week 8 = 0.006. Significant differences to controls are indicated by (*).
