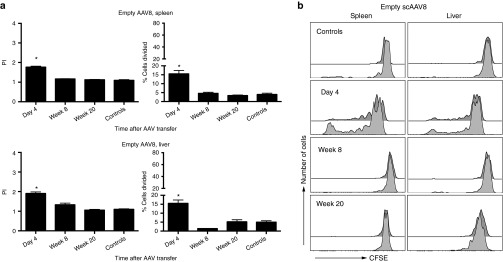
Figure 8.

Proliferation of CD8+ T cells from OT-1 mice in mice injected with empty AAV8 vector. The experimental design and the layout of the graphs are identical to those of experiments shown in Figure 2a,b using an empty AAV8(MOVA) vector, derived from a ssAAV preparation for injection of mice. Numbers of mice per group were as follows: (spleen) day 4 = 4, week 8 = 3, week 20 = 2, controls = 3; (liver) day 4 = 4,; week 8 = 5, week 20 = 4, controls = 4. For the proliferation indices, significant P values were as follows: (spleens) day 4 = 0.001; (liver) day 4, 0.001. For % cells proliferating, significant P values were as follows: (spleens) day 4 = 0.004; (liver) day 4 = 0.0009, week 4 = 0.006.
