
Figure 4.
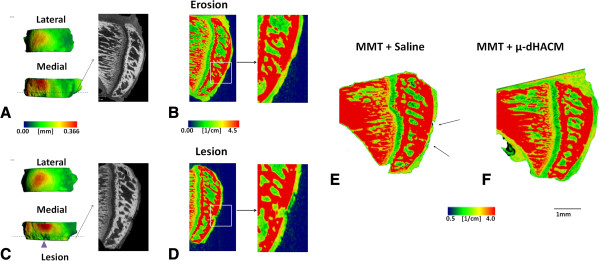
EPIC-μCT images depicting therapeutic effect of μ-dHACM in MMT joint. A) Representative image isolating erosion in MMT joint. B) Attenuation map indicating erosion on the MMT joint (Inset shows zoomed in view of erosion). C) Representative image isolating lesion in MMT joint. D) Attenuation map indicating erosion on the MMT joint (Inset shows zoomed in view of erosion). E-F) Pseudocolor attenuation map for EPIC-μCT sagittal tibial section for a saline injected (E) and dHACM injected (F) MMT joint. Red = higher attenuation values (lower PG content), green = lower attenuation values (higher PG content). Black arrows indicate focal defects. The μ-dHACM treated joints did not display lesions on the tibial articular cartilage surface. EPIC-μCT, equilibrium partitioning of an ionic contrast agent-micro computed tomography; MMT, medial meniscal transection; PG, proteoglycans; μ-dHACM, micronized dehydrated human amnion/chorion membrane.