
Figure 5.
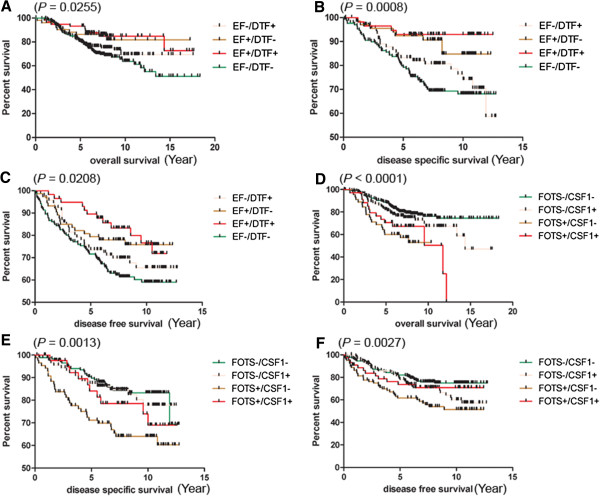
Kaplan-Meier plot with Log-rank (Mantel-Cox) test for the combined signatures. The plots and tests were performed between four categories of EF±/DTF ± (A, B, C) or FOTS±/TGCT/CSF1 ± (D, E, F) breast cancers with overall survival (A, D), disease specific survival (B, E), and disease free survival (C, F) (TGCT/CSF1 group is abbreviated to CSF1).