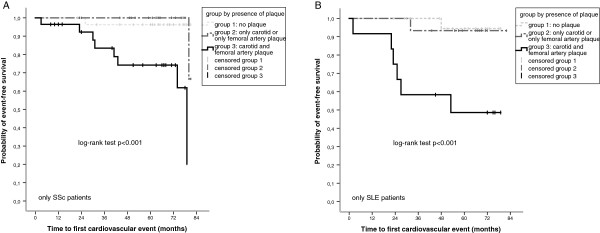
Figure 3.

Kaplan–Meier survival curves for the time to first cardiovascular event according to the presence of plaque. Kaplan–Meier survival curves for the time to first cardiovascular event during follow-up and results of a log-rank test stratified by (A) systemic sclerosis (SSc) and (B) systemic lupus erythematosus (SLE) according to the presence of carotid and femoral artery plaques. Group 1, patients without carotid or femoral artery plaque; group 2, patients with only carotid or only femoral artery plaque; group 3, patients with coexistent carotid and femoral artery plaque.
