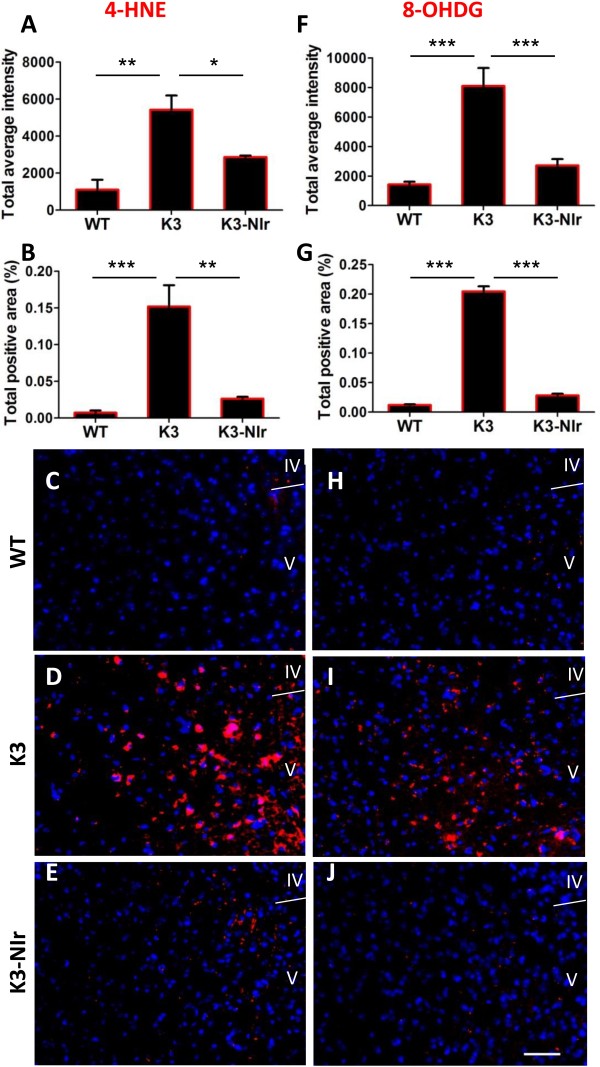
Figure 4.
Effect of near-infrared light treatment on oxidative stress markers in the neocortex of K3 mice. (A), (B), (F), (G) Quantification of immunolabelling of two oxidative stress markers, 4-hydroxynonenal (4-HNE; A, B) and 8-hydroxy-2′-deoxyguanosine (8-OHDG; F, G), based on average labelling intensity (A, F) and labelled area (B, G). All error bars indicate standard error of the mean. *P < 0.05, **P < 0.01, ***P < 0.001. (C), (D), (E), (H), (I), (J) Representative micrographs of 4-HNE (red) labelling (C, D, E) and 8-OHDG (red) labelling (H, I, J) within layers IV and V of the neocortical retrosplenial area. Nuclei were labelled with bisbenzimide (blue). Scale bar = 50 μm; scale in (J) applies to all other micrographs. NIr, near-infrared light; WT, wildtype.

