Figure 5.
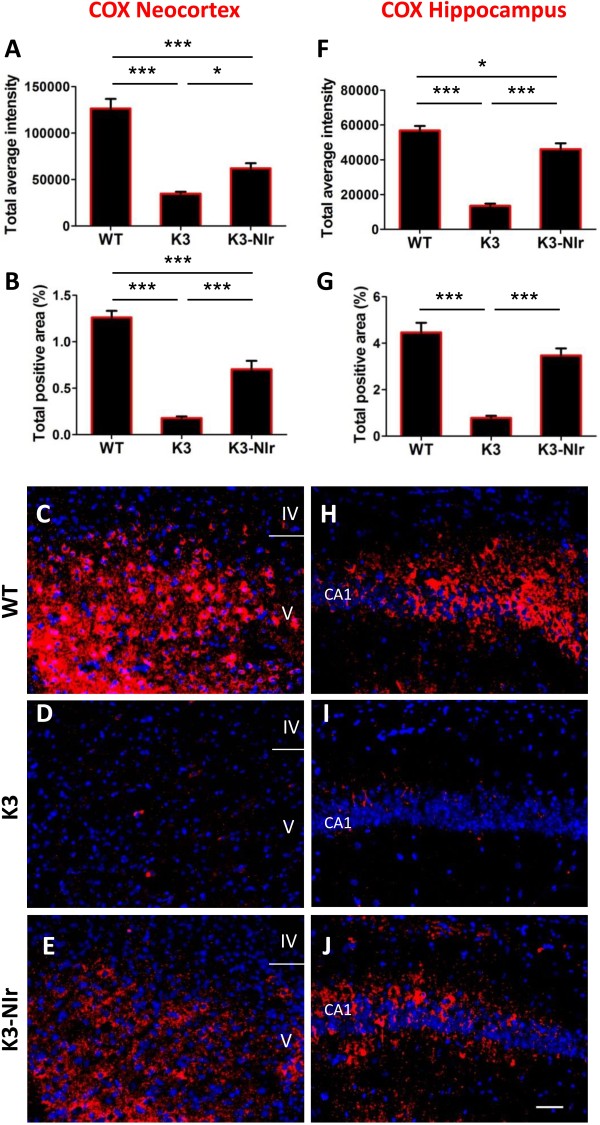
Effect of near-infrared light treatment on cytochrome c oxidase labelling in the neocortex and hippocampus of K3 mice. (A), (B), (F), (G) Quantification of immunolabelling of the mitochondrial marker cytochrome c oxidase (COX) in the neocortex retrosplenial area (A, B) and hippocampal CA1 layer (F, G), based on average labelling intensity (A, F) and labelled area (B, G). All error bars indicate standard error of the mean. *P < 0.05, ***P < 0.001. (C), (D), (E), (H), (I), (J) Representative micrographs of COX (red) labelling in the neocortex retrosplenial area (C, D, E) and hippocampal CA1 layer (H, I, J). Nuclei were labelled with bisbenzimide (blue). Scale bar = 50 μm; scale in (J) applies to all other micrographs. NIr, near-infrared light; WT, wildtype.

