Figure 1.
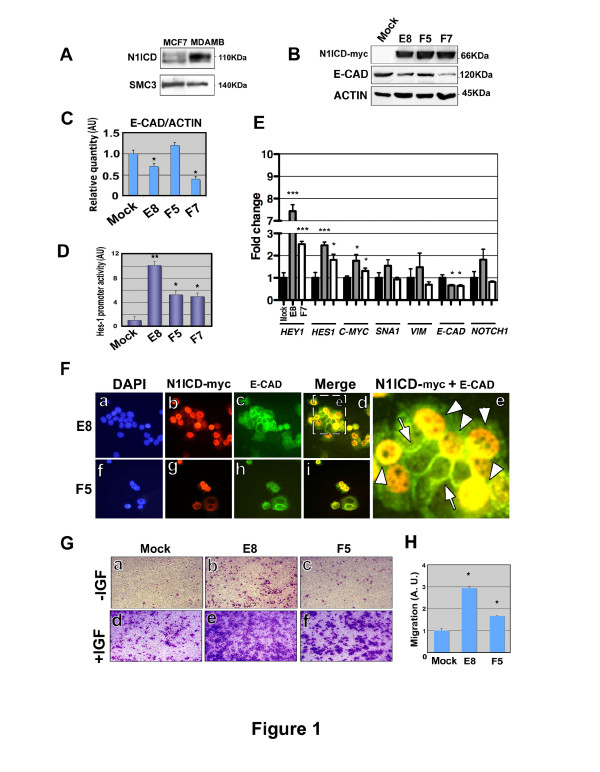
Stable N1ICD expression induces migration of MCF-7 cells. (A) Western blot showing expression of endogenous N1ICD in MCF-7 and MDABM231 cells. SMC3 (Structural Maintenance of Chromomosomes-3 protein) was used as a loading control. (B) Expression of N1ICD and E-CADHERIN in the stable MCF-7 clones E8, F5 and F7 besides with mock MCF-7 cells; β-ACTIN was used as a loading control. (C) The Western blot in (B) was quantified by densitometry and the ratio of E-CADHERIN/β-ACTIN calculated. (D) NOTCH activity was determined with a Hes-1 promoter fragment. The value in the clones is represented relative to the value in mock cells. Data are mean ± SEM of quadruplicates in three independent experiments (*P <0.05 determined by Student's t test). (E) Expression of HEY1, HES1, C-MYC, SNAI1, VIMENTIN, E-CADHERIN and NOTCH1 in the stable MCF-7 clones E8 and F7, measured by qPCR. Data are mean ± SEM of triplicates in two independents experiments (*P <0.05, ***P <0.001 determined by Student's t-test). (F) Staining of N1ICD (red), E-CADHERIN (green) and nuclei (DAPI, blue) in E8 and F5 MCF-7-N1ICD clones. Arrows indicate the intercellular staining of E-CADHERIN and arrowheads its intracellular accumulation. (G, H) Effect of ectopic N1ICD expression on the chemotaxis of E8 and F5 MCF-7 cell clones. (G) Representative images of transmigrated cells in basal (-IGF-1) and after IGF-1 addition (+IGF). (H) Quantification of the transwell assays. The migration index was calculated for each condition, and then referred to that of mock (considered as 1). Data are mean ± SEM of triplicates in three independent experiments (*P <0.05 determined by Student's t test). DAPI, 4,6-Diamidino-2-phenylindol; MCF-7, Michigan Cancer Foundation-7 breast cancer cell line; N1ICD, Notch one intracellular domain

