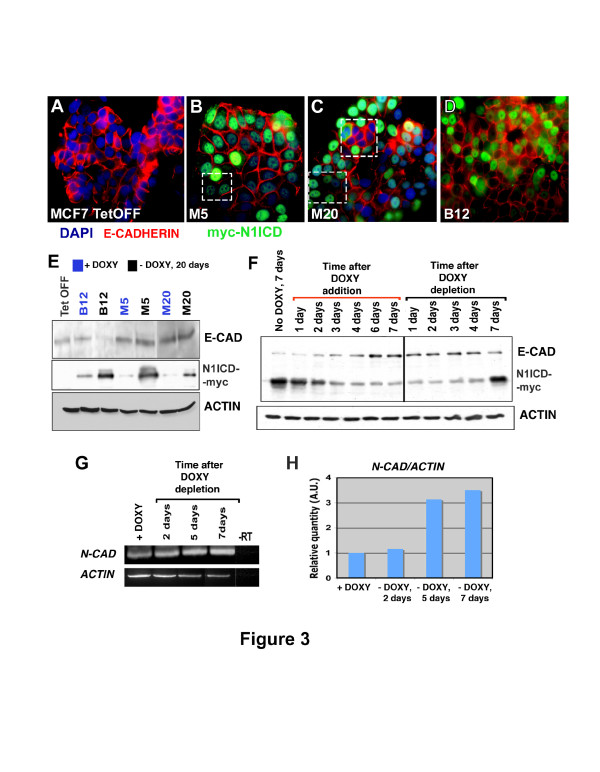
Figure 3.
E-CADHERIN and N-CADHERIN levels are modified in MCF-7 cells by overexpression of N1ICD. (A) Immunofluorescence staining of E-CADHERIN expression (red) in MCF-7 Tet-Off cells. (B-D) E-CADHERIN staining is lost in some cells where N1ICD (green) is induced. Nuclei are counterstained with DAPI (blue). (E) Western blot analysis of E-CADHERIN in MCF-7 mock and MCF-7 inducible clones in the presence (blue) or absence (black) of doxyxycline. (F) Time-course analysis of E-CADHERIN expression by Western blot after DOXY addition and depletion in clone B12. (G, H) N-CADHERIN transcription measured by RT-PCR in clone B12 after DOXY depletion. DAPI, 4,6-Diamidino-2-phenylindol; DOXY, doxyxycline; MCF-7, Michigan Cancer Foundation-7 breast cancer cell line; N1ICD, Notch one intracellular domain

