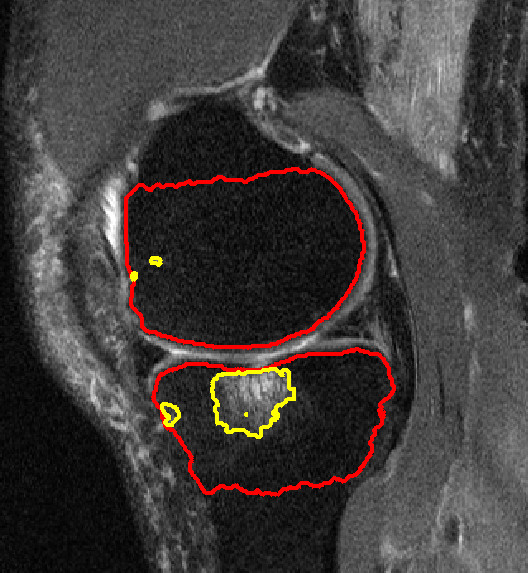
Figure 1.

Bone marrow lesion (BML) in the medial tibia. The red lines identify the bone boundary and the yellow lines surround areas of high signal intensity. The three small regions (two in femur, one in tibia) would be excluded from analyses since they do not appear on more than one image.
