
Figure 1.
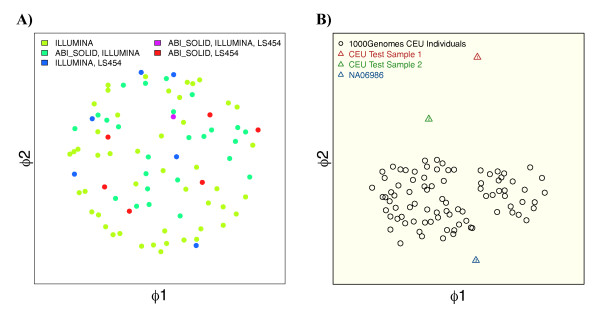
Similarities of exome samples. (A) The similarity between exome samples is measured with a genotype frequency weighted metric. The similarity matrix is visualized by non-metric multidimensional scaling in the two-dimensional plane. Variant sets of individuals of European descent that were analyzed by the 1000 genomes project form a homogeneous cluster, irrespective of the applied sequencing technology. (B) Two test samples of the same ethnicity that we genotyped according to a standard exome protocol are compared to samples of the reference set. The larger distance of sample 1 to the reference cluster indicates a lower genotyping accuracy, while sample 2 points to a high quality.