
Figure 4.
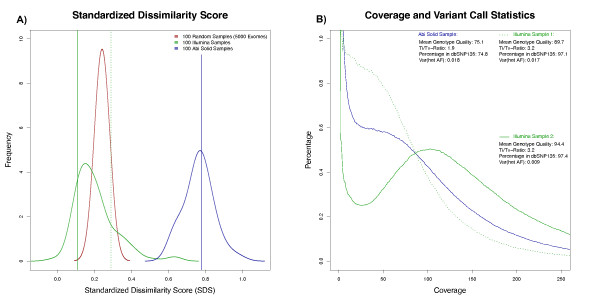
Distributions of standardized dissimilarity scores for different exomes. (A) 100 samples, including test samples 1 and 2, were sequenced on the Illumina platform with mean coverage above 60×. The mean SDS for the Illumina samples is comparable to the mean SDS of 100 exomes that were simulated based on genotype frequencies from the 5000 exomes project. The variation of these SDS is smaller due to missing haplotype information. (B) The mean SDS of 100 exomes that were sequenced on a Solid platform is considerably higher due to a lower and less uniform sequence distribution over the target region and due to less accurate variant calls.