
Figure 5.
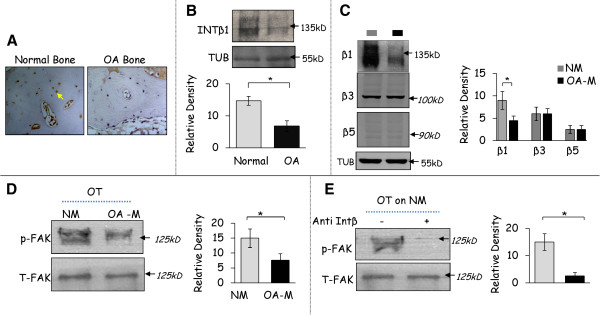
Expression of integrinβ1(INT-β1) - FAK signalling in osteocytic cells grown on normal and OA matrix. (A, B) Immunohistochemical and western blot analysis shows a decrease in the positively stained osteocytes (OT) for integrinβ1 in OA subchondral bone compared to normal bone collected from the human tibia. Images are representative of the experiments performed on three different patients. (C, D) Western blot analysis of integrinβ1, αVβ5 and αVβ3 and FAK phosphorylation in osteocytic cells that were grown on OA matrices (OA-M) compared to normal matrices (NM). Band density graphs are representative of the experiments performed on three different patient matrices. Results are shown as mean ± SD, * P ≤0.05 by Student’s t-test. (E) Decreased phosphorylation of FAK upon blocking integrinβ1 in osteocytic cells cultured on the normal matrices (NM). Images and graphs are representative of experiments performed on three patient matrices developed from normal and OA osteoblasts. Results are shown as mean ± SD, * P ≤0.05 by Student’s t-test.