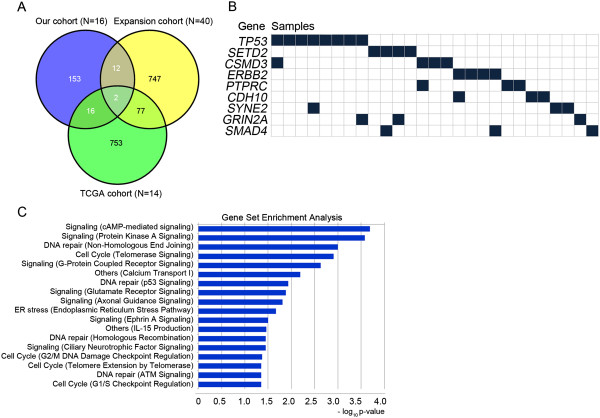
Figure 2.
Distribution and pathway analysis of somatic mutations. (A) Venn diagram plot comparing somatically altered genes among our cohort (N = 16), the expansion cohort (N = 40), and TCGA-LUAD cohort (N = 14). (B) Gene profiles across EGFR/KRAS-negative tumors from never-smokers. (C) Pathway analysis of altered genes in EGFR/KRAS-negative lung adenocarcinoma from never smokers (N = 70). The most significant functions are shown. TCGA-LUAD, The Cancer Genome Atlas - Lung adenocarcinoma.

