
Figure 1.
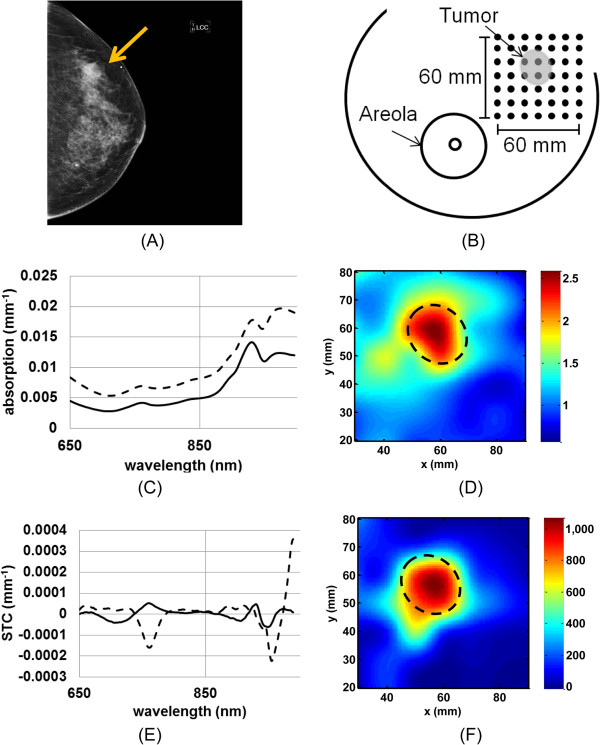
DOSI measurement with typical recovered absorption and STC spectra in tumor and normal tissue. A) Mammogram, left craniocaudal view, of a 39-year-old female subject with a 21 mm IDC in the left breast with a BI-RADS 3 density. The arrow points at the tumor. B) Schematic of the DOSI measurement grid for this subject. DOSI measurement locations are 10 mm apart in x and y directions. For this subject, the 60 x 60 mm2 grid covers the lesion and some normal tissue. C) Absorption spectra in lesion (dotted line), and background (solid line). D) TOI map. E) STC spectra in lesion (dotted line), and background (solid line). F) STC index map. Increased TOI and STC index values are found in the tumor area, highlighted with the dash line circle. BI-RADS, Breast Imaging Reporting and Data System; DOSI, Diffuse Optical Spectroscopic Imaging; IDC, Invasive ductal carcinomas; STC, Specific tumor component; TOI, Tissue optical index.