
Figure 5.
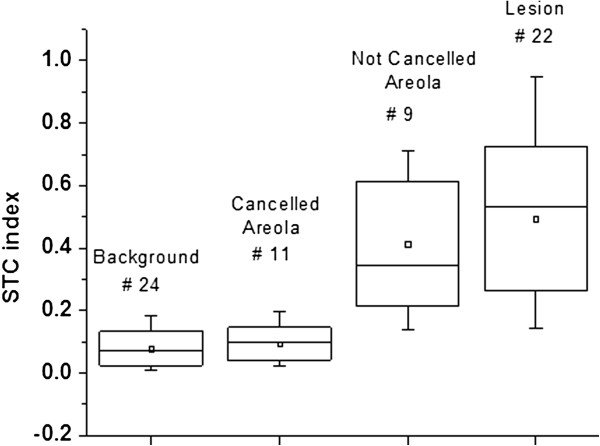
Box plot of STC index: no contrast in 11 out of 20 areolas. STC index values in the background normal tissue, STC Cancelled Areola, STC Not Cancelled Areola, and visible tumor. The number of patients for each region of interest is shown above each box. STC, Specific tumor component.