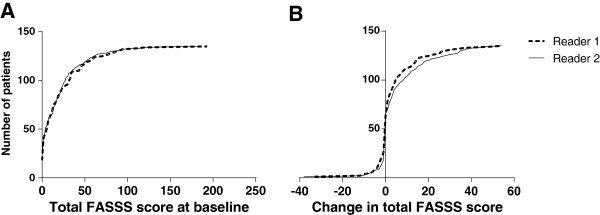
Figure 2.

Probability plots for total FAt Spondyloarthritis Spine Score status and change scores. Cumulative probability plots for the total FAt Spondyloarthritis Spine Score (FASSS) at baseline (A) and for change scores (B) for Exercise 2 (n = 135).
