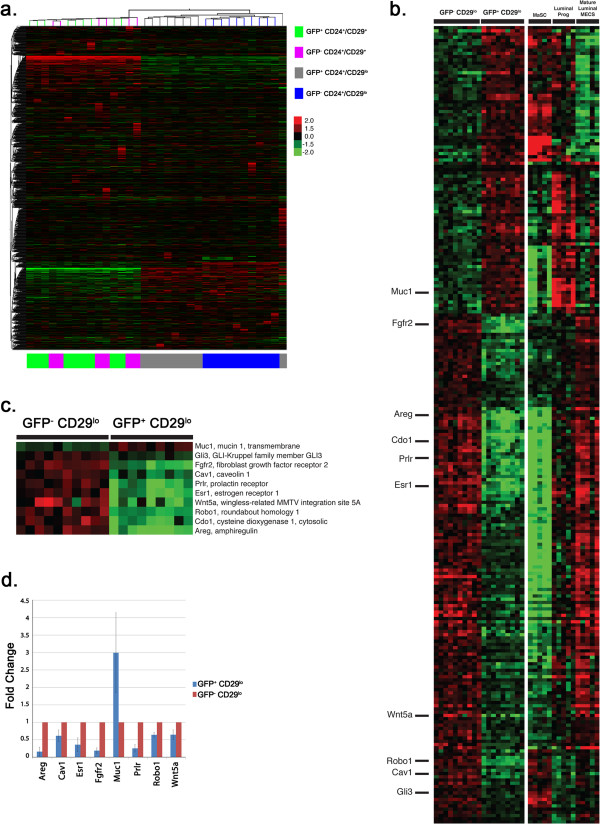
Figure 6.
Gene expression differences segregate MMTVrtTA/H2BGFP MECs into distinct subpopulations. (a) Gene expression data from the four MMTVrtTA/H2BGFP populations were analyzed using an unsupervised two-way hierarchical clustering of 35,927 filtered probes on the Illumina Mouse Whole Genome (WG-6 version 2 release 2) microarray. Samples in the CD29+CD24- populations can be seen to segregate into two distinct subpopulations based on the H2BGFP marker, whereas H2BGFP does not affect the clustering of CD29+CD24+ samples. (b-d) Differentially expressed genes between the H2BGFP+/CD24+/CD29lo and H2BGFP-/CD24+/CD29lo populations were compared with those found in a publicly available data set [36] consisting of isolated mammary stem cell-enriched (MaSC), luminal progenitor (lum prog) and mature luminal mammary epithelial cell (lum mature MEC) populations. The resulting 247 genes in common were plotted as a heat map (b). Ten genes (c) were chosen for further validation and follow-up analyses based on their association with mammary gland development and differentiation. (d) Validation of eight of these genes by quantitative RT-PCR. H2BGFP, histone 2B-eGFP; MMTV, mouse mammary tumor virus promoter; rtTA, reverse tetracycline transactivator.

