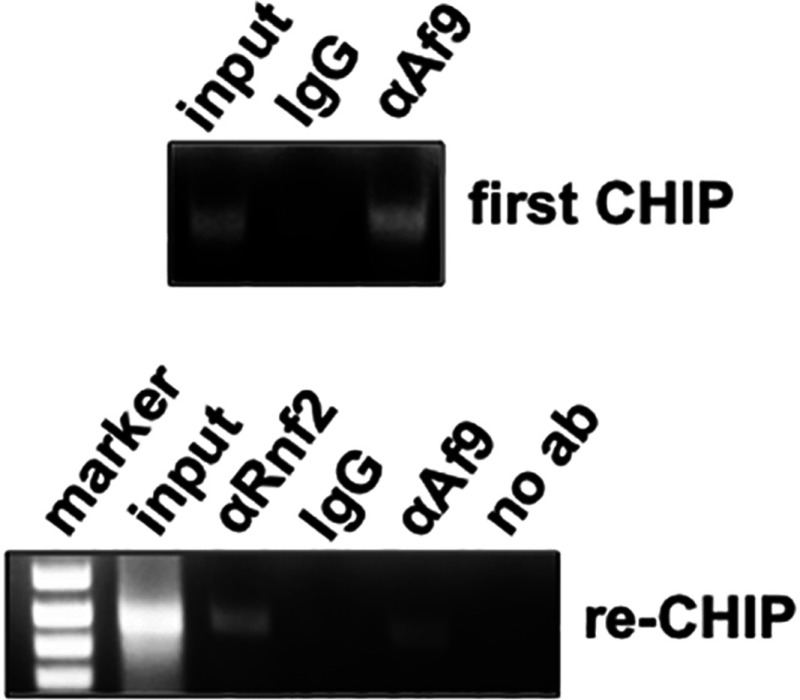
Figure 5. Sequential ChIP analysis showing co-occupancy of Rnf2 and Af9 at the R2 (−414/+80) subregion of the α-ENaC promoter.
Chromatin from mIMCD3 cells was sequentially IP with the Af9 antibody or IgG (‘First ChIP’), followed by re-ChIP with anti-Rnf2 antibody, Af9 (as a positive control) or IgG (as a negative control). Precipitated R2 subregion segments were amplified by PCR and resolved on agarose gels (representative of three independent experiments).

