3.
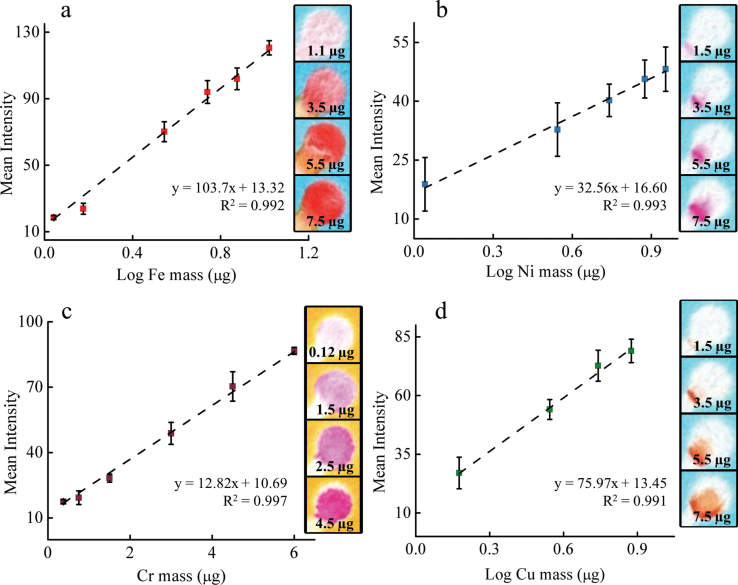
Typical response curves obtained for the measurement of acid-extractable (a) iron, (b) nickel, (c) chromium, and (d) copper. The linear response generated for each metal was 1.1–10 µg Fe, 1–10 µg Ni, 0.15–6 µg Cr, and 1.5–8 µg Cu. µPAD error bars are based on measurements between samples (N ≥ 4). Colorimetric intensity was determined using a desktop scanner. Raw samples images for each metal are included to the right of each calibration graph.

