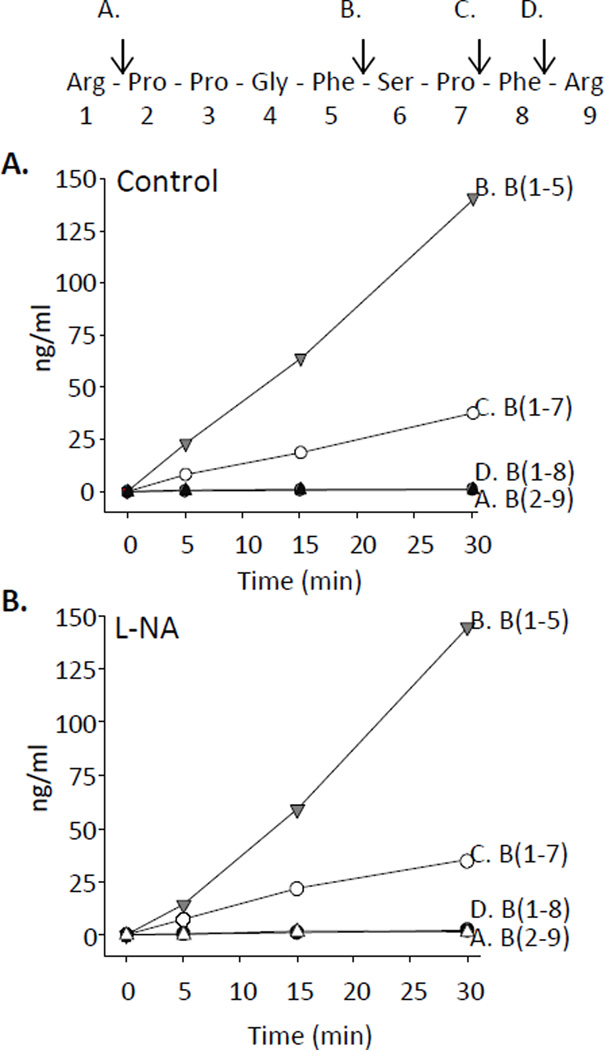
Figure 3.
Bradykinin metabolism in bovine coronary arteries. Bovine coronary arteries were incubated with bradykinin (1 µM) for 0, 5, 15 and 30 min under control conditions (A) without L-NA and (B) with L-NA (30 µM). Metabolites were extracted and analyzed by LC-MS. Bradykinin peptide sequence and metabolic cleavage sites are noted above panel A. Site A represents cleavage by aminopeptidase P and formation of B(2–9). Site B represents 2 successive cleavages by ACE and B(1–5) formation. Site C represents 1 cleavage by ACE and B(1–7) formation. Site D represents cleavage by carboxypeptidase and B(1–8) formation.

