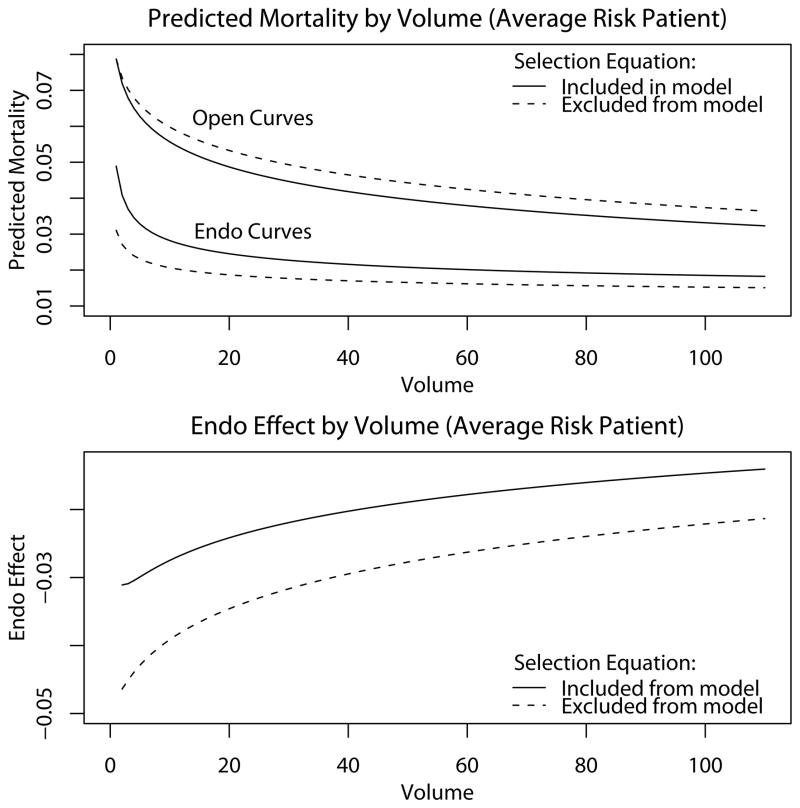
Figure 2. Plots of Predicted Probabilities of Mortality by Institutional Volume for an Average Risk Patient.
An average risk patient is a hypothetical patient having the sample average values of the covariates. The endo effect presented in the lower plot maps the curves in the upper plot onto the lines where endo and open volume are equal; a different trajectory would be obtained if (e.g.) open volume was twice endo volume or was constant. On most occasions, a patient attends a hospital where open volume exceeds endo volume and the institutional volume over the past year is less than 100 for both procedures.

