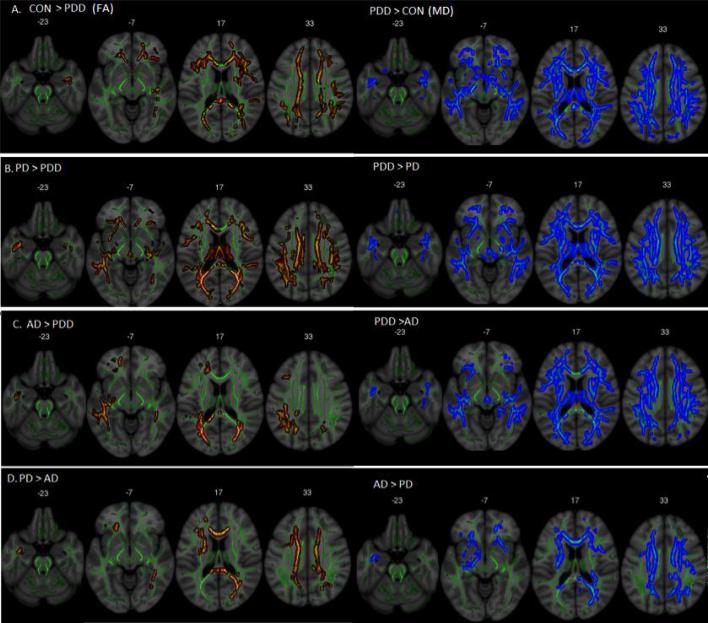
Figure 3.
Fractional anisotropy (in red) and mean diffusivity values (in blue). A) PDD showed a higher diffusion compared to controls in the corpus callosum, bilateral posterior inferior fronto-occipital fasciculus, and anterior projections regions. B) Lower diffusion in PDD compared to PD in posterior, anterior, and CC regions. C) AD shows higher diffusion when compared to PDD in the splenium of the CC and bilateral posterior fibers. D) AD showed lower diffusion values when compared to PD mainly in the corpus callosum, posterior right and anterior IFOF. All images are displayed in a Montreal Neurological Institute (MNI) background (in grey) with the mean FA skeleton superimposed (green).

