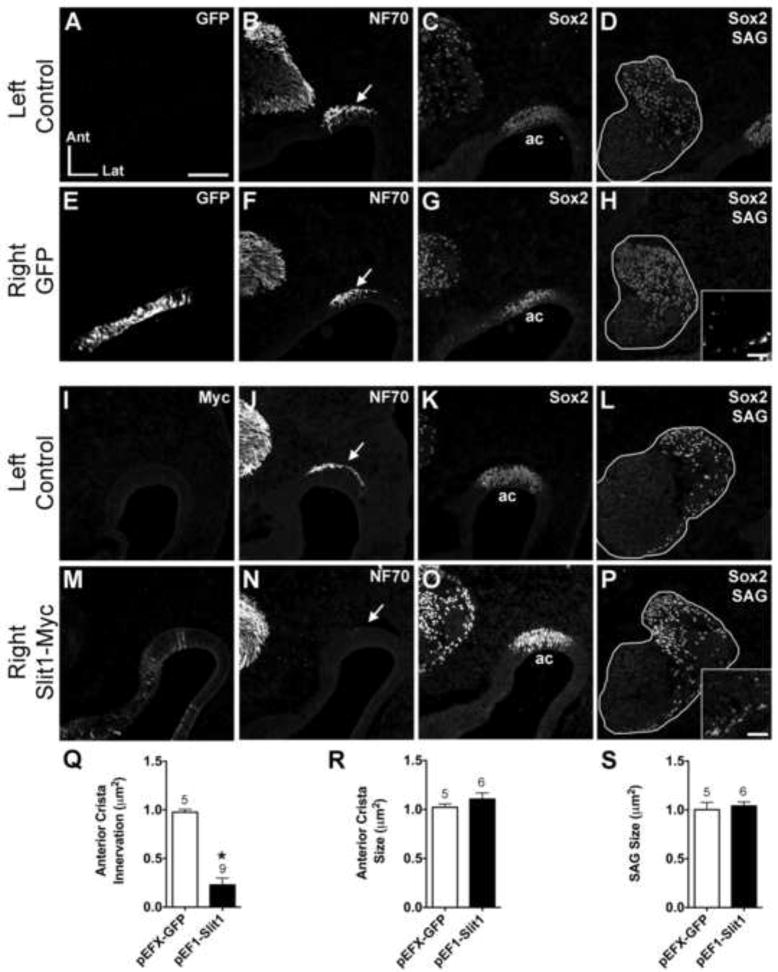
Figure 2. Anterior crista afferents are repelled from the anterior crista following pEF1-hSlit1 electroporation.
Serial horizontal sections through the left (unelectroporated) or right (electroporated) otocysts of embryos transfected with either pEFX-GFP (HH23; A-H) or pEF1-Slit1 (HH26; I-P). In these and subsequent figures, images of the left and right ear are from the same embryo, but the one side was mirror-image reversed to facilitate comparisons to the other side. Sections were immunostained with antibodies indicated in the upper right of each panel to label transfected cells (myc), axons (NF70) and prosensory domains (Sox2). Arrows indicate axon bundles adjacent to the anterior crista (ac) primordia. pEF1-Slit1 electroporation resulted in diffuse expression of Slit1-myc in the anterior crista primordium (M). The anterior crista of the Slit-electroporated ear (N) lacks afferent innervation as compared to the control ear of the same embryo (J). Sox2 marks the anterior crista primordium in each ear (C, G, K, O). The size and position of the SAGs (outlined in white) are similar across treatment groups (D, H, L, P). Insets in H and P show GFP- and Myc- immunolabeled cells in the SAGs, respectively. Quantification of anterior crista innervation (Q), anterior crista size (R), and SAG size (S). *p<0.0001 statistically significant from unelectroporated controls. The number above the bars represents the number of ears analyzed in each treatment group. Abbrevations: Ant, anterior; ac, anterior crista; Lat, lateral; SAG, statoacoustic ganglion. Scale bar in Panel A = 100 μm for all large panels. Scale bar for insets in Panel H = 25 μm.

