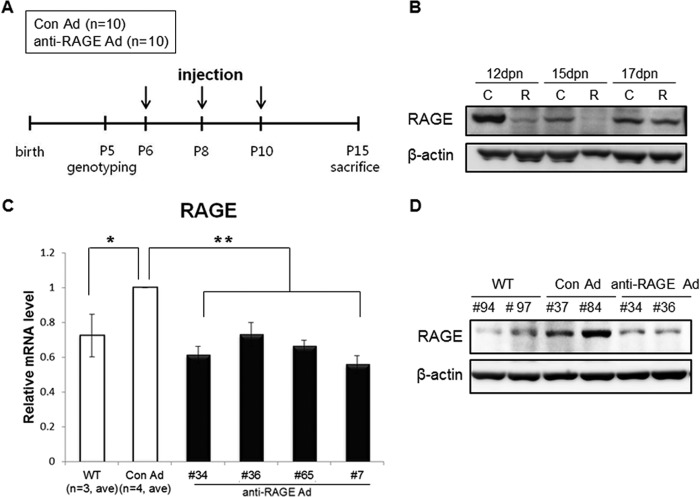
FIGURE 3.
Injection of anti-RAGE adenovirus into PC2R mice. A, schematic view of adenovirus injection. Genotyping was performed at 5 days postnatal (dpn). Control or anti-RAGE adenovirus was injected three times intravenously into PC2R mice. Injected mice were sacrificed at P15, and organs and blood were collected. Arrows indicate time points when mice were injected. B, duration of adenovirus effect in PC2R. After finishing the intravenous injection at P10, we sacrificed mice at three time points (P12, P15, and P17) and isolated the kidneys. RAGE protein remained low until 5 days after the final injection. However, protein levels at P17 (7 days after the last injection) were restored. C, control adenovirus-injected PC2R group; R, anti-RAGE adenovirus injected PC2R group. C, real-time polymerase chain reaction analysis to check RAGE mRNA level in the injected PC2R mice and WT littermate mice. RAGE mRNA levels (30–40%) decreased in the treated anti-RAGE adenovirus-treated group (WT; n = 3, Con Ad (control adenovirus-injected PC2R mice), n = 4; anti-RAGE Ad (anti-RAGE adenovirus-injected PC2R mice), n = 4. D, Western blot analysis to check RAGE protein level in the injected PC2R mice. Western blotting was performed to confirm efficiency of the adenovirus infection. Total protein was extracted from PC2R mice and WT littermate mice. The numbers of PC2R mice are listed on the blot.

