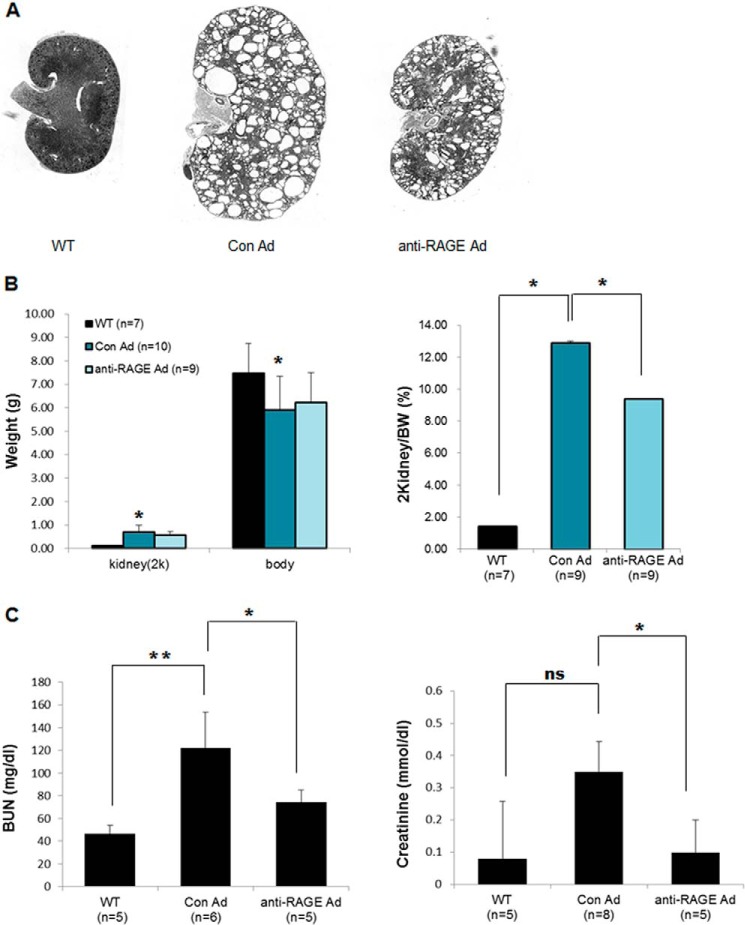
FIGURE 4.
Knockdown of RAGE suppressed cystogenesis in PC2R mice. A, morphological comparison of the kidneys in each group. Representative data are presented. B, differences in kidney weight/total body weight between PC2R mice in each group. The weight of both kidneys and total body weight of the mice were measured. Then, the kidney weight/total body weight was calculated. Normal, WT littermates (n = 7); PC2R + Con Ad, control adenovirus-injected PC2R mice (n = 9); PC2R + anti-RAGE Ad, anti-RAGE adenovirus-injected PC2R mice (n = 9). C, analysis of BUN and creatinine levels. Serum was harvested from blood, and the BUN and creatinine levels were measured. WT littermates (n = 5); control adenovirus-injected (BUN; n = 6, Cr; n = 8); anti-RAGE adenovirus-injected (n = 5). Data are mean ± S.D. (error bars). **, p < 0.001; *, p < 0.05; ns, nonsignificant.

