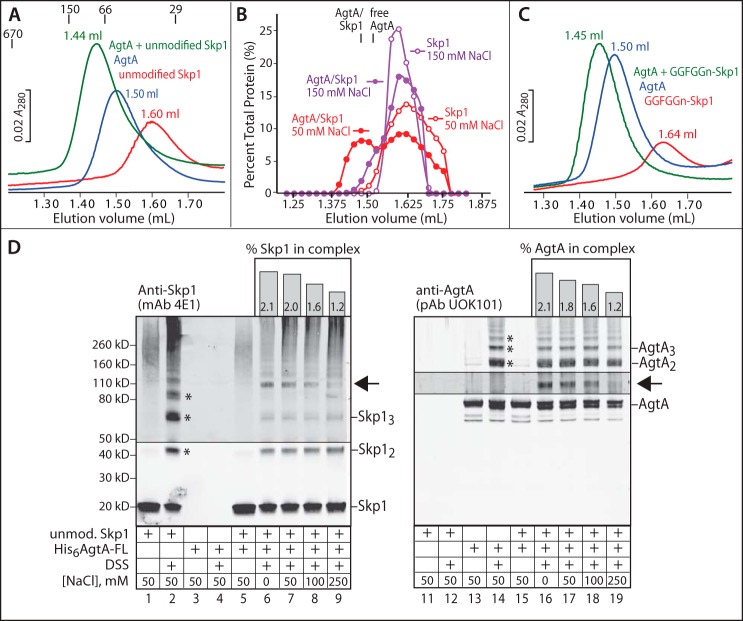
FIGURE 4.
Physical interaction of AgtA and Skp1. A, 0.1 nmol of His6AgtA-FL, unmodified Skp1, or His6AgtA-FL preincubated with unmodified Skp1 were chromatographed on a Superdex 200 column in 50 mm NaCl, and monitored based on A280. Peak elution volumes are denoted. Elution positions for porcine thyroglobulin (Mr 670,000), alcohol dehydrogenase (150,000), bovine serum albumin (66,000), and carbonic anhydrase (29,000) are denoted. B, densitometric analysis of Western blots of Skp1 elution positions from A and an identical experiment in 150 mm NaCl. The elution positions of free AgtA-FL and the AgtA·Skp1 complex, which were not affected by the NaCl concentration, are denoted. C, gel filtration analysis of the interaction of AgtA-FL with fully modified Skp1 (GGFGGn-Skp1) as in A. Profiles shown in panels A–C are representative of 2–3 independent trials. D, parallel Western blots of cross-linking reactions performed on AgtA-FL (600 nm), unmodified Skp1 (600 nm), or a mixture with each at 600 nm. Samples were reacted with 0.25 mm DSS for 10 min at the indicated NaCl concentrations. Lower order multimers of Skp1 and AgtA are denoted with asterisks, and the position of a novel AgtA- and Skp1-dependent band is denoted with an arrow. Imaging of this region of the blot was reoptimized with respect to this band. The percentage of Skp1 and AgtA found in this band is plotted as a function of NaCl concentration above the Western blot lanes. Data shown are representative of 3 independent trials.

