
FIGURE 3.
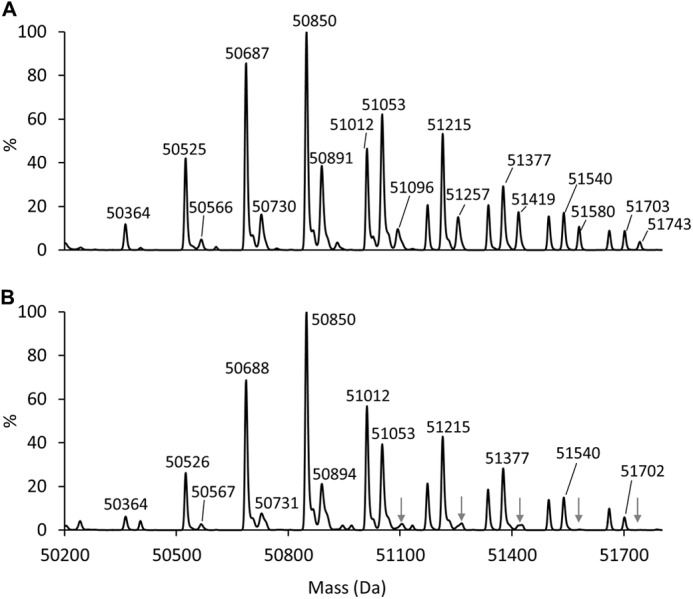
Mass spectrometric analysis of intact sVSG221 from WT and TbGT11 null mutant trypanosomes. Samples of whole sVSG of WT (A) or TbGT11 null mutant cells (B) were analyzed by ES-MS, and the spectra were deconvolved by maximum entropy. Significant differences in the sVSG glycoform patterns are indicated by arrows in panel B. The compositions of the various glycoforms are given in Table 1.