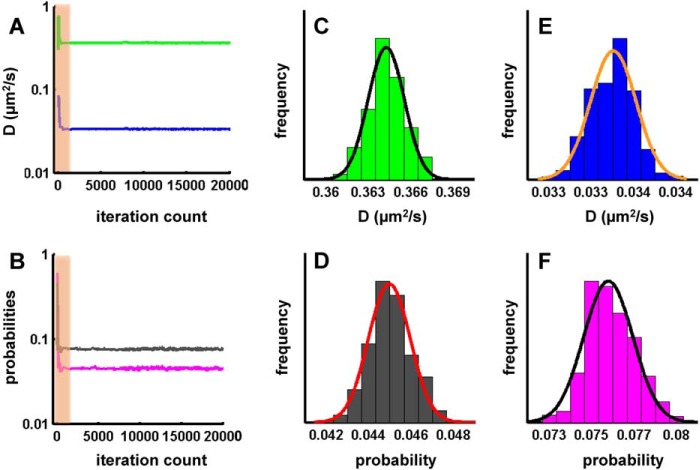
FIGURE 8.
Maximum likelihood optimization run for an analysis by a two-state hidden Markov model. Optimization started with uniformly distributed random initial parameter estimates. A and B, representative plots of diffusion coefficients D1 (A, green) and D2 (A, blue) and for the probabilities p12 (B, black) and p21 (B, magenta) of A2A receptor-383RVRAA387 versus the number of iterations. The shaded area represents the burn-in phase. C–F, uncertainty of parameter estimates for D1 (C), D2 (D), p12 (E), and p21 (F) fitted with a single Gaussian distribution.

