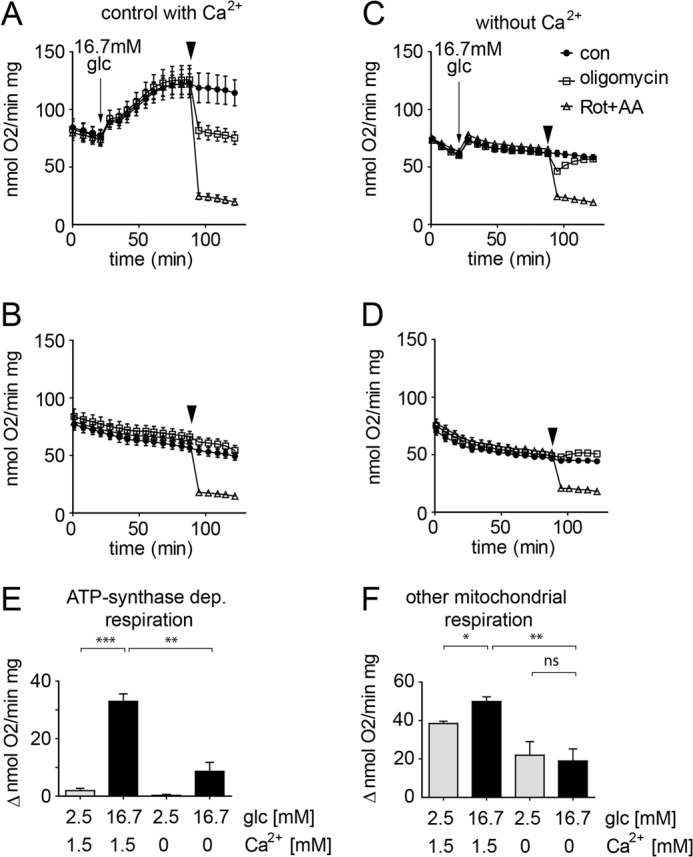
FIGURE 3.

Glucose- and calcium-induced activation of ATP synthase-dependent respiration in INS-1E cells. INS-1E cells were assayed in standard KRBH containing 1.5 mm Ca2+ (A and B) or a KRBH lacking Ca2+ but including 0.4 mm EGTA (Ca2+-free; C and D). The cells were stimulated by adding glucose to a final concentration of 16.7 mm (A and C, arrow) or maintained continuously under basal conditions 2.5 mm glucose (B and D). Inhibitors of the respiratory chain were added as indicated (arrowhead). For each dataset the following conditions were tested: rotenone (Rot; 1 μm) plus antimycin A (AA; 1 μg/ml) (open triangles), oligomycin (2.5 μg/ml; open squares), control (con, DMSO; closed circles). Quantification of ATP synthase-dependent (E) and ATP synthase-independent (F) respiration (see “Experimental Procedures”). A–D, representative results are shown (n = 6, mean ± S.E.). E and F, quantification of the respiration data (average ± S.E.) under control conditions (n = 6) and Ca2+-free conditions (n = 4). Glc, glucose. *, p < 0.01; **, p < 0.001; ***, p < 0.0001; ns, not significant.
