FIGURE 1.
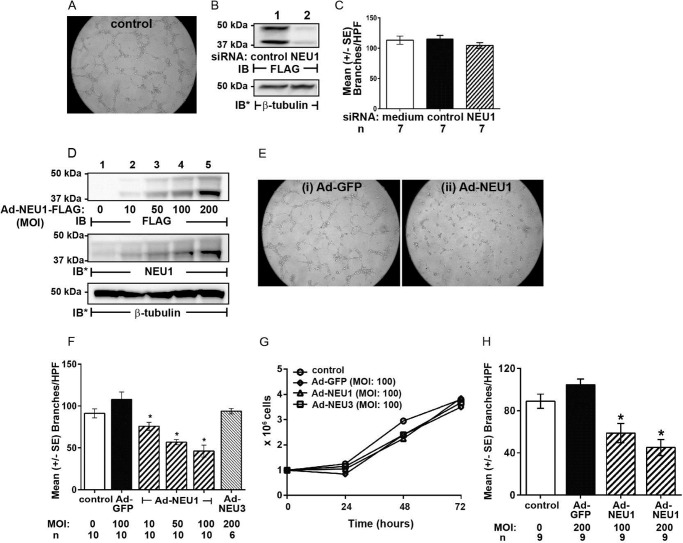
NEU1 inhibits EC capillary-like tube formation. A, photomicrograph of noninfected HPMECs at 6 h after seeding on Matrigel at 1.5 × 10⁴ ECs/well. Magnification is ×10. B, HPMECs infected with Ad-NEU1-FLAG were transfected with NEU1-targeting or control siRNAs and lysed, and the lysates were processed for FLAG tag (NEU1) immunoblotting. To control for protein loading and transfer, blots were stripped and reprobed for β-tubulin. C, HPMECs and HPMECs transfected with either NEU1-targeting or control siRNAs were seeded on Matrigel, incubated for 6 h, and photographed, and branches of capillary-like tubes were counted. For each condition, n = 7. D, HPMECs were infected with increasing MOIs of Ad-NEU1-FLAG and lysed, and the lysates were processed for FLAG tag immunoblotting. The blots were stripped and reprobed for endogenous NEU1, and to control for protein loading and transfer, they were stripped and reprobed for β-tubulin. IB, immunoblot; IB*, immunoblot after stripping. Molecular mass in kDa is indicated on the left. Each blot is representative of at least two independent experiments. E, photomicrographs of Ad-GFP-infected (i) and Ad-NEU1-infected (ii) HPMECs at 6 h after incubation on Matrigel (MOI = 100). Magnification is ×10. F, HPMECs and HPMECs infected with Ad-GFP (MOI = 100), Ad-NEU1 (MOI = 10, 50, and 100), or Ad-NEU3 (MOI = 200) were incubated for 6 h on Matrigel, at which time they were photographed, and branches of capillary-like tubes were counted. G, HPMECs and HPMECs infected with Ad-GFP, Ad-NEU1, or Ad-NEU3, each at MOI = 100, were cultured at equivalent seeding densities (105 ECs/well) and manually counted with trypan blue exclusion every 24 h for a total of 72 h. Each symbol represents mean ECs/ml. n = 2. H, HPAECs and HPAECs infected with Ad-GFP (MOI = 100) or Ad-NEU1 (MOI = 100 or 200) were incubated for 6 h on Matrigel, at which time they were photographed, and branches of capillary-like tubes were counted. In C, F, and H, each vertical bar represents mean ± S.E. (error bars) branches/HPF. In F and H, the MOI and n for each condition are indicated below each bar. *, significantly decreased compared with the simultaneous Ad-GFP-infected control at p < 0.05.

