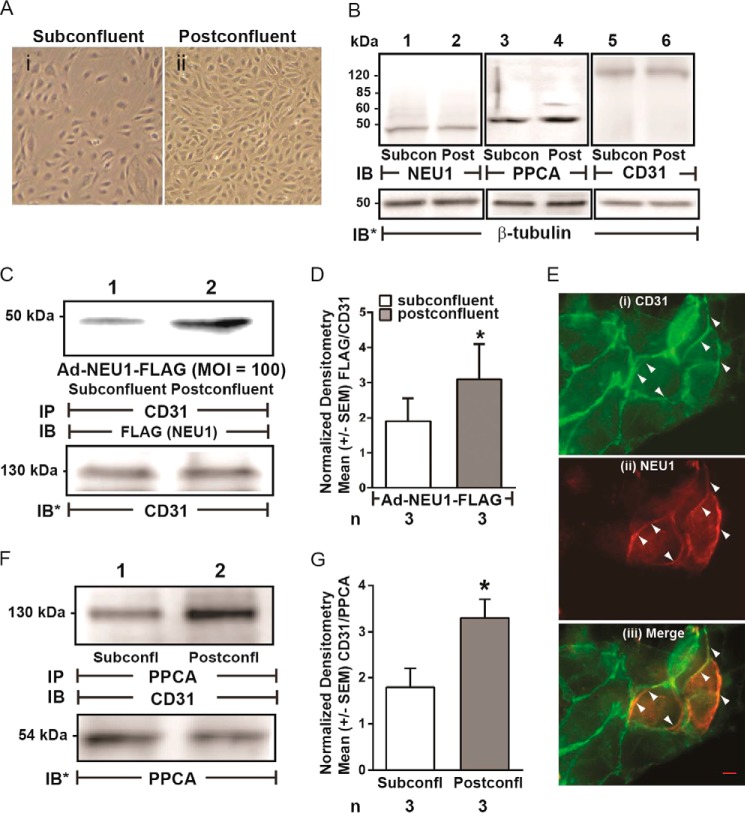
FIGURE 6.
NEU1 is recruited to CD31 in postconfluent ECs. A, photomicrographs of HPMECs cultured to subconfluent (i) and postconfluent (ii) states. Magnification is ×10. B, lysates from subconfluent and postconfluent HPMECs were processed for NEU1 (lanes 1 and 2), PPCA (lanes 3 and 4), and CD31 (lanes 5 and 6) immunoblotting. To control for protein loading and transfer, the blots were stripped and reprobed for β-tubulin. C, HPMECs infected with Ad-NEU1-FLAG (MOI = 100) were allowed to achieve subconfluent or postconfluent states and lysed, and the lysates were immunoprecipitated with anti-CD31 antibodies. The CD31 immunoprecipitates were processed for immunoblotting with anti-FLAG antibody. To control for protein loading and transfer, the blots were stripped and reprobed for CD31. E, after preinfection with Ad-NEU1-FLAG, HPMECs were cultured to postconfluence and probed for CD31 (i) and NEU1 (FLAG) (ii), after which the two images were merged (iii). A 20-μm scale bar is shown. Arrows indicate CD31 signal (i), NEU1 (FLAG) signal (ii), or NEU1/CD31 co-localization (iii). F, lysates of subconfluent and postconfluent HPMECs were immunoprecipitated with anti-PPCA antibodies, and the PPCA immunoprecipitates were processed for CD31 immunoblotting. To control for protein loading and transfer, the blots were stripped and reprobed for PPCA. IP, immunoprecipitation; IB, immunoblot; IB*, immunoblot after stripping. Molecular mass in kDa is indicated on left. Each blot is representative of three independent experiments. D, densitometric analyses of the blots in C. Vertical bars, mean ± S.E. (error bars) FLAG (NEU1) signal normalized to CD31 signal in the same lane on the same blot (n = 3). G, densitometric analyses of the blots in F. Vertical bars, mean ± S.E. CD31 signal normalized to PPCA signal in the same lane on the same blot (n = 3). *, significantly increased FLAG/CD31 or CD31/PPCA densitometry of postconfluent versus subconfluent cells at p < 0.05.

