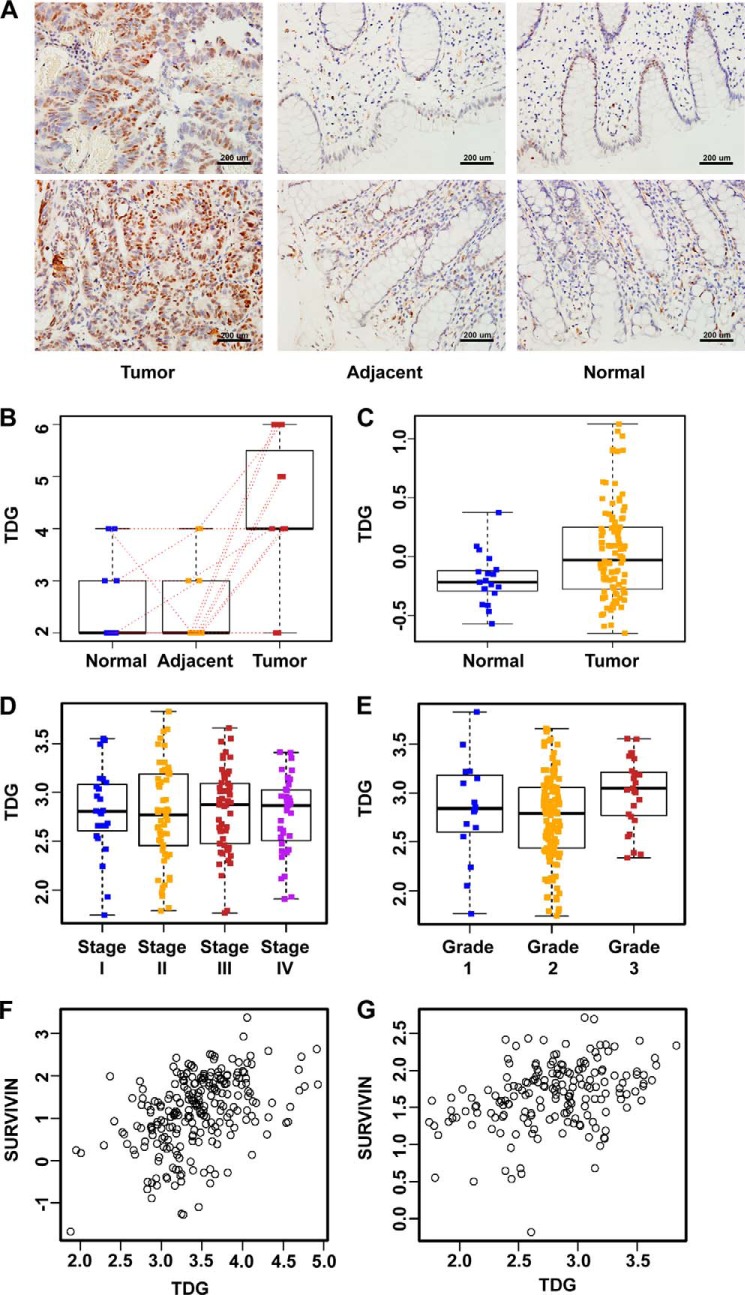
FIGURE 1.
TDG is up-regulated in CRC. A, immunohistochemistry analysis of TDG in tumors, adjacent tissues, and normal tissues from the same patients. TDG expression was increased significantly in human colon cancer tissues. B, statistical analysis of TDG expression in tumor and normal tissues from Nanfang Hospital (supplemental Table S1). TDG expression was significantly higher in tumors than in adjacent tissues (p = 0.001) and normal tissues from the same patients (p = 0.007). Red dotted lines indicate scores from the same patient. C, TDG expression is significantly higher in colon adenocarcinoma patients than in normal controls, according to the TCGA database (276 tumor and normal pairs). D, TDG expression in patients with different tumor stages on the basis of data from Smith et al. (35). p = 0.92 (177 patients from the Moffitt Cancer Center as the independent dataset; stage I, 24 patients; stage II, 57 patients; stage III, 57 patients; stage IV, 39 patients). E, TDG expression in patients with different tumor grades on the basis of data from Smith et al. (35). p = 0.013. F and G, correlation between TDG expression and survivin expression in two human colon cancer microarray data sets. F, Smith et al. (35); Pearson's correlation coefficient = 0.36 (95% confidence interval, 0.22–0.48; p < 0.001). G, Pearson's correlation coefficient = 0.44 (95% confidence interval, 0.33–0.54, p < 0.001). (M. Bittner (Expression Project for Oncology, International Genomics Consortium)).

