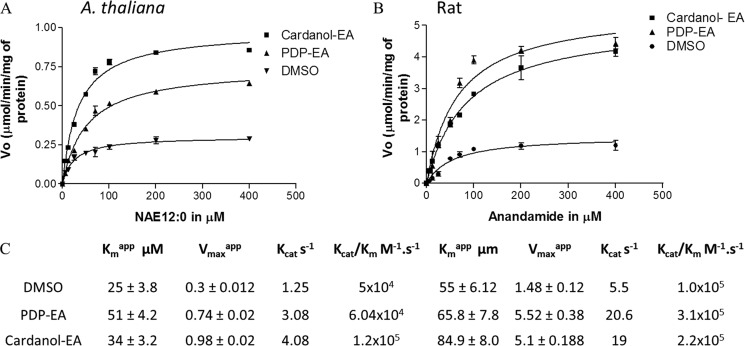
FIGURE 6.
Kinetic characterization of At-FAAH1p and rat FAAH in the presence of 100 μm PDP-EA or cardanol-EA. Initial velocities were measured at increasing concentrations of [1-14C]NAE 12:0 for At-FAAH (A) or [1-14C]-NAE 20:4 for rat FAAH (B). Reactions were initiated by the addition of purified protein (0.3 μg). C, apparent kinetic parameters of the enzymes estimated by transformations of these original data (i.e. double-reciprocal plots). Reactions were carried out in 50 mm BisTris propane- HCl (pH 9.0) at 30 °C in a final volume of 0.15 ml. Data points represent means ± S.D. (error bars) of triplicate assays. Velocity is given in μmol/min/mg of protein. Plots were generated with Prism software version 3.0 (GraphPad Software), and data were fitted to a nonlinear regression (curve fit) using a one-site binding (hyperbola) equation with a R2 between 0.93 and 0.98.

