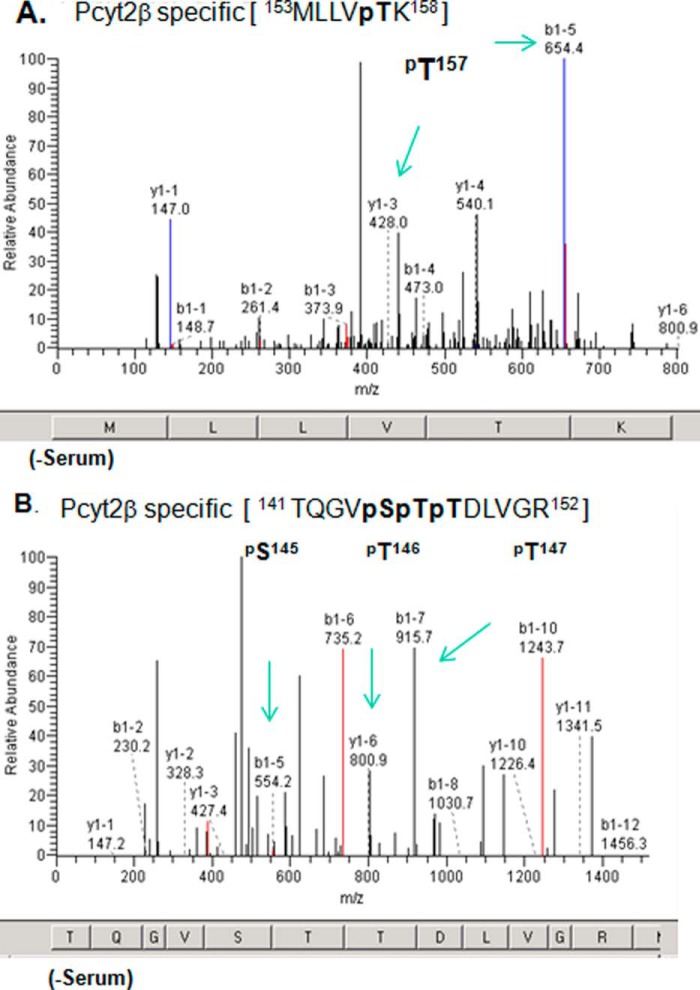
FIGURE 2.
Identification of Pcyt2β-specific phosphorylation. Cells overexpressing V5/His-tagged Pcyt2β were grown in the presence and absence of serum for 24 h. Pcyt2β was isolated, and phospho-enriched peptides were analyzed by MALDI-Qq-TOF tandem mass spectroscopy. Panels are fragmentation patterns for the phosphopeptide species indicated at the top. A and B are spectra for two Pcyt2β peptides with specific phosphorylation at βSer-145, βThr-146 and -147, and βThr-157. The identified phosphorylations are located in Pcyt2β N-cat domain (Fig. 1) and were not retrieved from analyses on Pcyt2α. The “y1”-ion series corresponds to the C-terminal peptide fragmentation, and “b1”-ion series corresponds to the N-terminal peptide fragmentation. Amino acids corresponding to m/z are shown at the bottom of each spectrum. The specific ions (m/z) of the phosphorylated residues are indicated. Spectra are representatives of at least three independent experiments. The panels show results from samples obtained from cells without serum. The phosphopeptides are not detected in the presence of serum.

