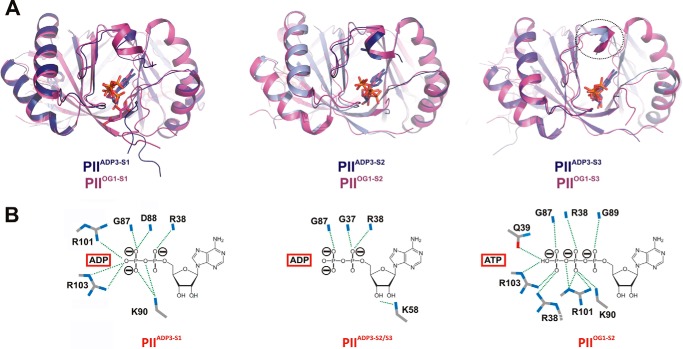
FIGURE 4.
Comparison of PIIADP3 and PIIOG1 structures. A, superposition of the two trimer structures PIIADP3 (dark blue) and PIIOG1 (magenta) showing the side view of the three binding sites. B, comparison of the structures of the ADP and ATP binding modes in PIIADP3-S1, PIIADP3-S2, and PIIOG1-S2. Interacting residues are represented by stick structures and are labeled.

