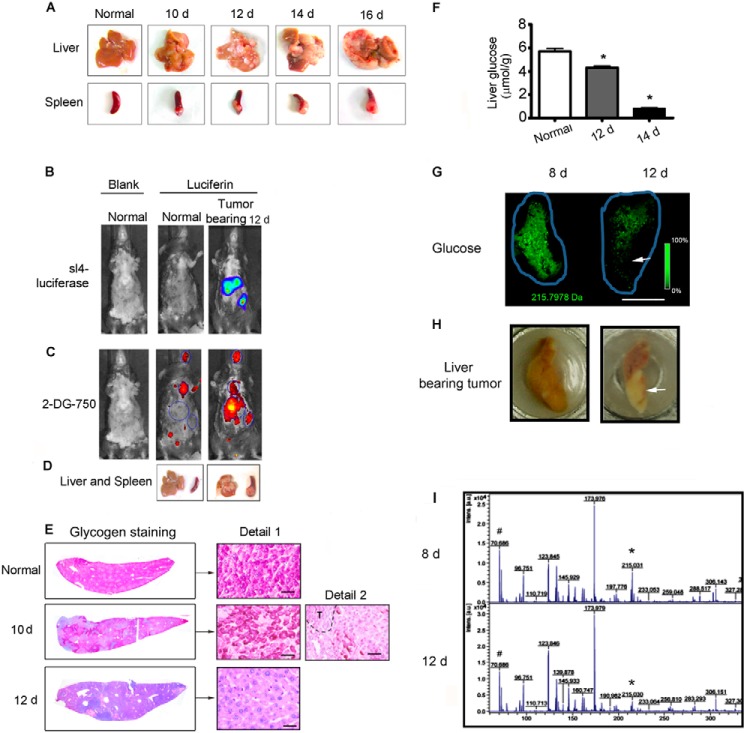
FIGURE 1.
Liver metastasis of colon cancer resulted in energy deprivation of liver remnant. A, the spleens of C57 BL/6 WT mice (n = 12) were injected with 5 × 10⁵ SL4 tumor cells that stably expressed luciferase. Tumor-bearing livers and spleens were harvested at 10, 12, 14, and 16 days after injection. B, bioluminescence imaging after d-luciferin injection on 12 day after SL4 injection showed luciferase activity from SL4, indicating the tumor location and size. C, the same mice as B (above) were intravenously injected with a 10-nmol 2-DeoxyGlucosone (DG) 750 probe and imaged at 45 min with IVIS spectrum (excitation, 745 nm; emission, 820 nm) to show the extra accumulation of glucose by the tumor. D, the corresponding tumor-bearing liver and spleen of mice in B and C. E, glycogen staining of liver sections, in feeding condition, 10 and 12 days after SL4 injection and of normal (control) liver. Glycogen storage decreased as the tumor developed in the liver. The dashed line indicates the tumor region. Scale bar, 50 μm. F, glucose levels in liver remnants on days 10 and 14 after SL4 injection and in normal (control) livers. The hepatic glucose level decreased as the tumor developed in the liver (n = 6 each group). G, mass spectrometry imaging of glucose in tumor-bearing liver on days 8 and 12 after SL4 injection. Green is the false color from (glucose + 35Cl)−. It also shows that the hepatic glucose level decreased as the tumor developed in the liver. The blue line indicates the scanned area. The arrow indicates the tumor region. Scale bar, 5 mm. H, the corresponding tumor-bearing liver of G was imaged, whereas the fresh frozen slide was cryosectioned. I, the representative mass spectrometry spectrum of G. * indicates the peak of (glucose + 35Cl)−, m/z 215.03, and # indicates the internal reference peak of (H35Cl + 35Cl)−, m/z 70.75. d, day(s).

