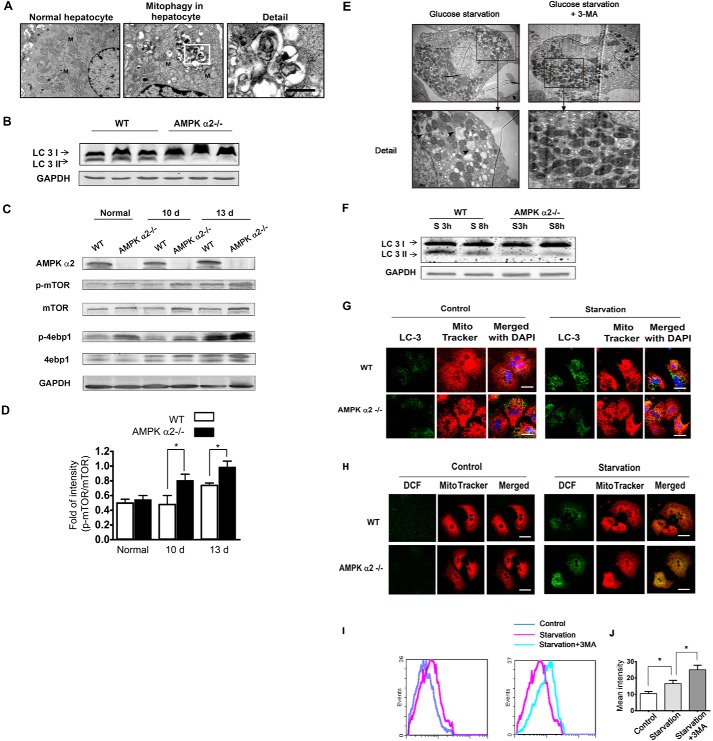
FIGURE 5.
AMPK α2 deficiency enhanced ROS accumulation by decreasing mitophagy, which was related with mTOR signaling pathway. A, liver tissue was harvested 12 days after SL4 injection. Electron microscopy shows the mitophagy in hepatocytes from the tumor-bearing liver. B, the livers were harvested 12 days after SL4 injection, lysed, and subjected to Western blot with antibodies against LC3 and GAPDH. The LC3 II levels decreased in the tumor-bearing livers of AMPK α2−/− mice. C and D, the livers were harvested 10 and 13 days after SL4 injection, lysed, and subjected to Western blot with antibodies against AMPK α2, p-mTOR, mTOR, p-4ebp1, 4ebp1, and GAPDH. The phosphorylation level of mTOR and its substrate, 4ebp1, both increased in AMPK α2-deficient tumor-bearing livers. E, primary hepatocytes underwent 36 h of glucose starvation, with or without autophagy inhibitor (3-MA) treatment, and were harvested for electron microscopic analysis. The mitophagy was reduced by the 3-MA. F, the lysate from primary hepatocytes was analyzed with LC3 antibody by Western blot, after 3 and 8 h of glucose starvation. AMPK α2 deficiency decreased the level of LC3 II. G, primary hepatocytes were cultured with or without glucose for 36 h. Cells were incubated with Mito Tracker for 20 min, and the autophagosome level was then detected by immunofluorescence of the LC3 antibody. Many autophagosomes colocalized with mitochondria, suggesting mitophagy. AMPK α2 deficiency decreased the colocalization. Scale bar, 10 μm. H, localization of ROS and mitochondria were detected by Mito Tracker Red and FITC-CM H2DCFDA. Cells were incubated with Mito Tracker for 20 min, and the fluorescence was recorded 20 min after FITC-CM H2DCFDA was added. A large amount of ROS produced after glucose starvation colocalized with mitochondria. DCF indicates FITC-CM H2DCFDA. Scale bar, 10 μm. I and J, primary hepatocytes were cultured with or without glucose or 3-MA for 36 h. Hepatocytes were then trypsinized and oxidized to the FITC-CM H2DCFDA for 20 min and analyzed using a FACSCalibur flow cytometer. The results indicated that 3-MA enhanced ROS production after glucose starvation. d, day(s).

