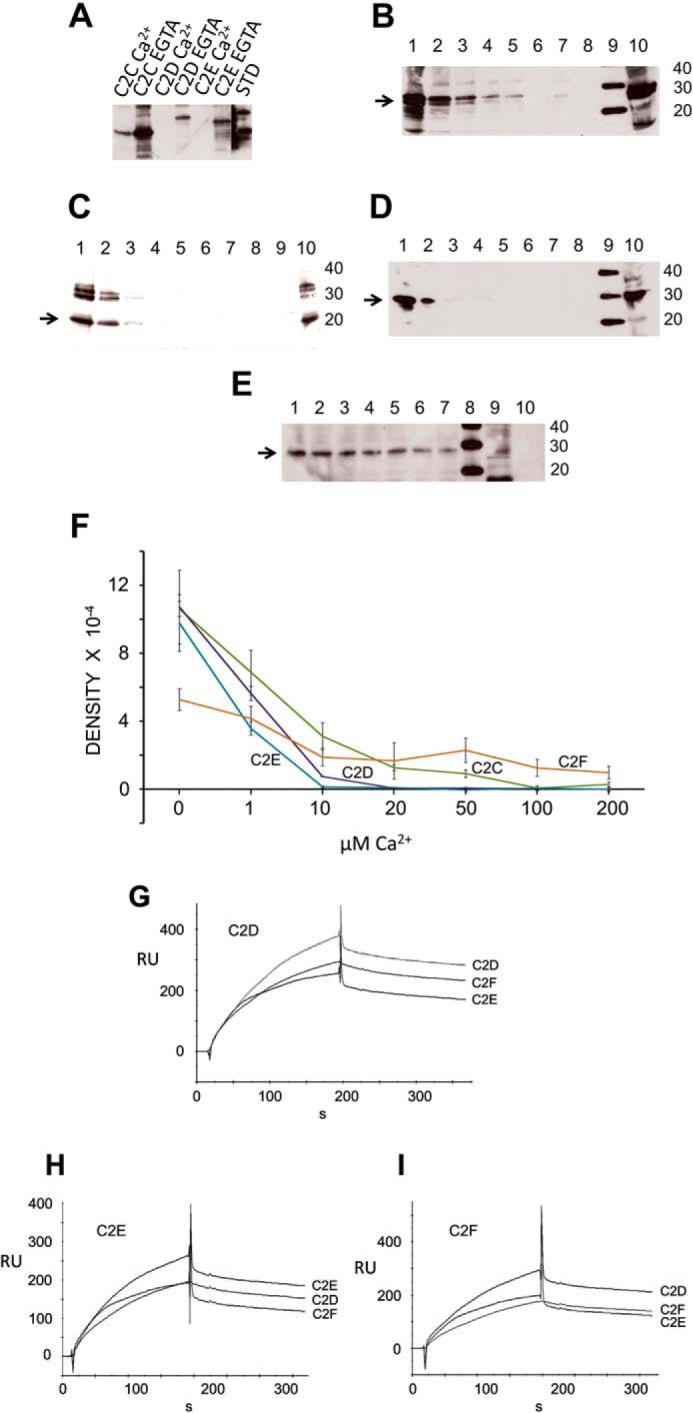
FIGURE 10.

Otoferlin C2 domain self-interaction. A, otoferlin C2 domains interact with one another maximally at low calcium. In a GST pulldown assay utilizing GST-C2F as a probe, we observed that the C2C, C2D, and C2E domains each interacted with the C2F domain in the essential absence of calcium. Addition of 100 μm calcium significantly reduced the interactions. (Individual lanes are labeled. STD, standard.) B, otoferlin C2F/C2C interaction is diminished by calcium. The GST-C2F domain was used as a probe, and His-tagged C2C fusion protein was used as a target in pulldown assays with increasing amounts of calcium. C2C bands were detected by anti-Xpress antibody in a chemiluminescence reaction. The estimated molecular mass of the fusion product is 27 kDa (arrow). Lane 1, 0 μm Ca2+; lane 2, 1 μm Ca2+; lane 3, 10 μm Ca2+; lane 4, 20 μm Ca2+; lane 5, 50 μm Ca2+; lane 6, 100 μm Ca2+; lane 7, 200 μm Ca2+; lane 8, GST negative control; lane 9, molecular mass standard; lane 10, aliquot representing ∼5% of the volume of the total C2C domain lysate used in the binding assay. C, otoferlin C2F/C2D interaction is abolished by increasing calcium. Similarly to experiments in B, pulldown assays were performed in a series with increasing amounts of calcium, and the His-tagged C2D bands were detected in a chemiluminescence reaction using anti-Xpress antibody. The arrow indicates the C2D band (25 kDa). The format is the same as for B. D, otoferlin C2F/C2E interaction is abolished by an increase in calcium. Conditions and labeling are the same as those for B. The arrow indicates the C2E band, estimated to be 29 kDa. E, C2F/C2F interaction is moderately inhibited by calcium. Pulldown assays were performed with a calcium concentration series similar to that shown in B. F, plots of C2/C2 domain interactions. Intensities of the C2 domain bands in the pulldown experiments were estimated by GelQuant.NET (Biochem Lab Solutions), and the averages from three independent gels for each sample were plotted using Excel with calculated S.E. (error bars). Interaction of C2E, C2D, and C2C domains with C2F showed severe inhibition in the range of 1–10 μm Ca2+ with only small to negligible interaction beyond 10 μm calcium. A relatively protracted decline of interaction with an increase in calcium occurred for the C2F/C2F self-interaction. G, C2D interaction with C2D, C2E, and C2F by SPR. Purified C2D domain was immobilized on a CM5 sensor chip and used as ligand. Purified C2D, C2F, and C2E fusion peptides were diluted in calcium-free HSB buffer and used as analytes. H, C2E ligand interaction with C2E, C2D, and C2F as analytes performed in a manner similar to that shown for G. I, C2F ligand interaction with C2D, C2F, and C2E as analytes. RU, response units.
