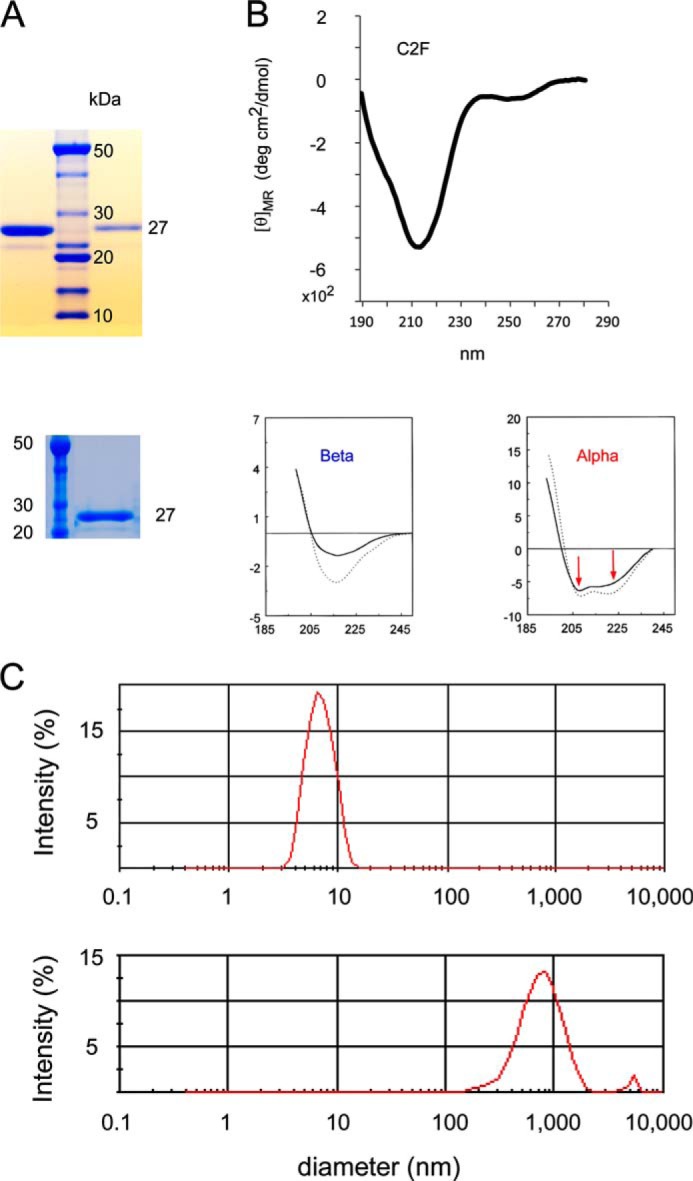
FIGURE 3.

Characterization of otoferlin C2F domain protein by gel electrophoresis, circular dichroism, and light scattering. A, two SDS gels illustrating purity of otoferlin C2F domain of ∼27 kDa used in the present studies (upper gel, first lane, 2 μg of C2F protein; upper gel, third lane, 300 ng of C2F protein; lower gel, second lane, 1.5 μg of C2F protein) compared with molecular mass standards. GST-C2F fusion peptides were cleaved with PreScission protease to remove the GST tag, and the purified C2F domain was dialyzed via a dialysis centrifugation (Amicon) to exchange the buffer and concentrate the sample. An aliquot of each preparation was run in a SDS-polyacrylamide gel, and the protein was stained with SimplyBlueTM protein stain (Invitrogen). The faint satellite band probably represents a minor breakdown product. B, circular dichroism spectrum for purified C2F domain. The single minimum at ∼215 nm is characteristic of the β-sheet in contrast to two minima observed for α-helical proteins (see panels below spectrum from data originally published by Sreerama et al. (17)). Protein concentration was 0.5 μm. deg, degrees. C, C2F domain protein as assessed by light scattering. The upper panel shows the C2F peak with particle diameter of ∼6 nm (peak maximum), corresponding to a monomer with an estimated hydrodynamic molecular mass of 31 kDa and calculated molecular mass of 25 kDa. The plot indicates that the protein is non-aggregating under the solution conditions and sample concentrations used (0.5 μg/μl). As a comparison, the lower panel shows light scattering for the same C2F protein of the upper panel after its denaturation in 1 m urea. The broad peak represents a particle size in the range of 1,000 nm, consistent with the presence of aggregates centering at 3,380-kDa molecular mass.
