FIGURE 7.
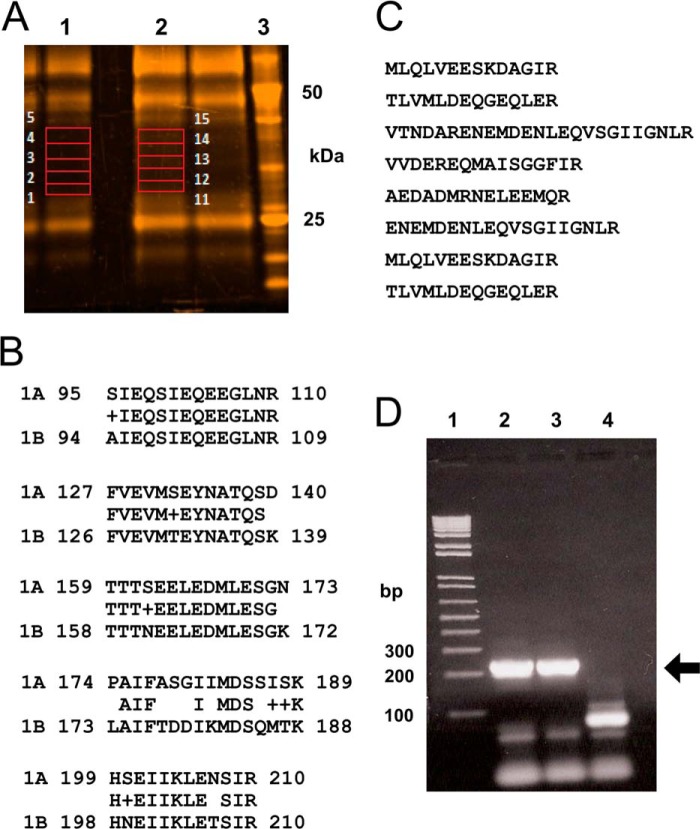
Identification of t-SNARE proteins by proteomic analysis of the otoferlin interactome. A, rat brain lysate was used for immunoprecipitation with anti-otoferlin antibody. After washing steps, the co-precipitates were analyzed by SDS-PAGE on a 4–12% gel and stained with SYPRO Ruby (Invitrogen). Gel slices from selected areas of control immunoprecipitation and anti-otoferlin immunoprecipitation (in red boxes) were treated with trypsin and processed for liquid chromatography-mass spectrometry as described under “Experimental Procedures.” Slices 1–5 from the control reaction (lane 1) and slices 11–15 from the corresponding region of the anti-otoferlin reaction (lane 2) were analyzed. Lane 3 is a molecular mass marker (BenchMarkTM, Invitrogen). B, peptides characteristic of syntaxin-1B were detected with otoferlin immunoprecipitation. Five unique peptides with sequences representative of the syntaxin-1B isoform were identified (rows labeled “1B”). The latter are compared with the corresponding regions of syntaxin-1A obtained from the database (rows labeled “1A”). Amino acid alignments for at least four of the peptides show significant differences between the two isoforms, indicating that only syntaxin-1B (not any other syntaxin isoform) was detected even though brain is known to express many syntaxin isoforms, most of them of similar molecular mass. No syntaxin-like sequences were detected in control immunoprecipitations. C, SNAP-25 sequences detected by proteomic analysis of otoferlin interactions. Eight peptides exactly corresponding in sequence to SNAP-25 were detected in the otoferlin immunoprecipitation reactions but were not detected in control immunoprecipitations. D, expression of syntaxin-1B transcripts in the apical and basal turns of the rat cochlear organ of Corti. RT-PCR was carried out to detect expression of syntaxin-1B transcripts in organ of Corti cDNA preparations. Specific primers were designed to amplify syntaxin-1B sequences (see supplemental Table 1), targeting an estimated size of 210 bp. Lane 1 shows molecular mass standards (1 Kb Plus, Invitrogen). Lanes 2 and 3 show RT-PCR analysis of the apical and basal portions, respectively, of the rat organ of Corti. Lane 4 is a negative control (water blank). Strong bands can be seen at the level of the 200-bp standard, which is marked by the arrow. Primer pairs used in these experiments spanned at least one intron, allowing discrimination of mRNA message from genomic DNA. Organ of Corti RNA was treated with DNase before cDNA synthesis.

