
Figure 6. Effects of LA-exposure on the distribution of CD36 and GPR120 in raft fractions in human (A, B & C) and mouse (D, E & F) fungiform TBC.
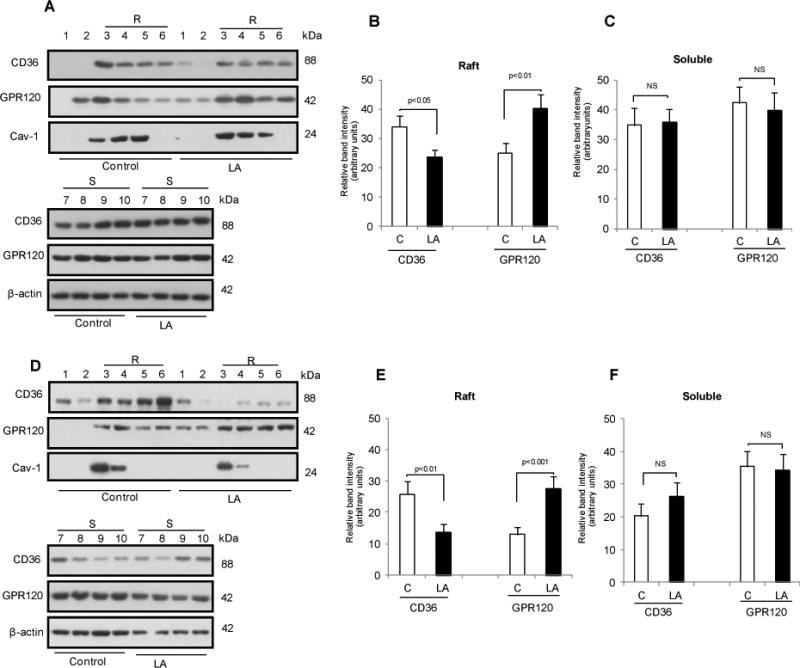
The TBC were treated or not (control) with 20 μM LA for 20 min A & D: Cells were homogenized in 1% Triton X-100 at 4°C, and the lysates were subjected to discontinuous 5–40% sucrose gradient centrifugation. Different fractions were collected from the top of the gradient, and equal volumes of aliquots from each fraction were subjected to western blot. Histograms show the relative band intensity (arbitrary units) measured by densitometry of protein content in raft (3-6) and soluble fractions (7-10). The data were normalized with respect to band intensity of caveolin-1 (Cav-1) for raft fractions and β-actin for soluble fractions, measured under similar conditions. B & C are derived from A and E & F are derived from D. Data are means ± SEM conducted in triplicates.